Comodo Help
Find the desired product help
Xcitium Secure Email Gateway MSP

Xcitium Secure Email Gateway MSP

Admin Guide

English

Print Help Download Help
Domain Management > Manage A Domain > Domain Dashboard
  • Introduction To Xcitium Secure Email Gateway - MSP
    • Purchase Licenses
    • License Information
  • Get Started
  • Login To The Admin Console
  • The Admin Console
  • The Dashboard Area
  • Domain Management
    • Add A Domain
    • Delete Domains
    • Edit Domains
    • Validate Domains
    • Manage A Domain
      • Domain Dashboard
      • Incoming
        • Quarantine
        • Manage Archived Mails
        • Incoming Spam Detection Settings
        • Report Spam
        • Delivery Queue
        • Destination Routes
        • Local Recipients
        • Clear Incoming Cache
        • Log Search
        • Domain Aliases
        • Domain Settings
        • Manage Report Subscriptions For Selected Domain
        • Relay Restrictions
        • Geolocation Restrictions
        • SPF Control Settings
      • Outgoing
        • Clear Outgoing Cache
        • Log Search
        • Users
        • Office 365 Activation
      • Email Management
        • Email Size Restriction
        • Blocked Extensions
        • Released Requests
        • Blacklisted Requests
        • White-listed Requests
      • Domain Audit Log
        • Audit Log Configuration
        • View Domain Log
      • Domain Rules
        • Rules
        • TLD And GTLD Rules
        • Recipient Whitelist
        • Sender Whitelist
        • Recipient Blacklist
        • Sender Blacklist
        • Whitelist Senders Per User
        • Blacklist Senders Per User
      • Account Management
        • User Account Management
        • Manage User Auto-import
        • View User History
        • Import Users From LDAP
          • LDAP Import Configuration
          • LDAP Import Confirmation List
          • LDAP Import Ignore List
  • Audit Log
  • Administrator Account Management
    • Administrators
    • User Groups & Permissions
    • Admin Groups & Permissions
    • My Comodo Account
    • My Profile
    • Users History
  • Customer Management
    • End User License And Subscriber Agreements
    • View License Information
    • Manage Report Subscriptions
    • Notification Email Settings
  • CSEG Reports - An Overview
    • Quarantine Report
    • Domain Statistics Report
    • Auto-Imported Users Report
    • Quarantine Release Report
    • Reported Spam Report
  • Appendix 1 - CSEG Error Codes
  • Appendix 3 - Troubleshooting LDAP
  • Appendix 4 - Useful Links
  • About Xcitium Security Solutions

Domain Dashboard


  • Domain dashboards provide a fast heads-up on mail activity on your protected domains. Statistics include the number of quarantined mails, release requests, whitelist requests, blacklist requests, incoming mails archive quota usage and more.
  • You can export the dashboards to image or pdf file by clicking the download icon at the top-right of each item.

Open a domain dashboard

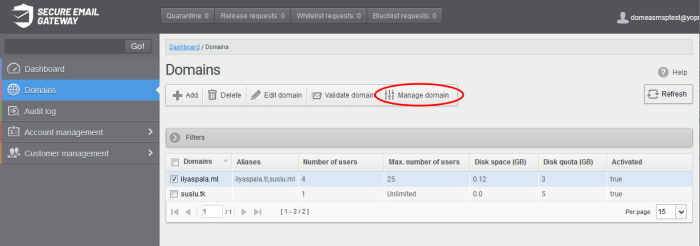
  • Click the 'Domains' menu on the left
  • Select the domain that you want to manage
  • Click the 'Manage Domain' button
  • Alternatively, click on the domain name in the 'Domains' column
OR
  • Right-click on the domain name in the 'Domains' column to open in a new tab or window


The dashboard of the selected domain is displayed:


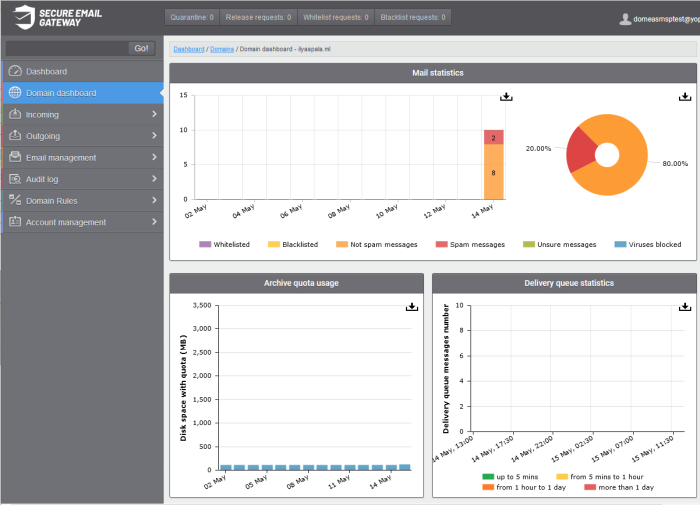
The buttons along the top of the dashboard allow you to view and take action on important items:

  • Quarantine - Quarantined mails of all users of the selected domain. See Quarantine for more details.
  • Release requests - Requests from users on the selected domain to release quarantined mails. See Released Requests for more details.
  • Whitelist requests - Requests from users on the selected domain to whitelist the senders of quarantined mails. See Whitelisted Requests for more details.
  • Blacklist requests - Requests from users on the selected domain to blacklist the senders of quarantined mails. See Blacklisted Requests for more details.

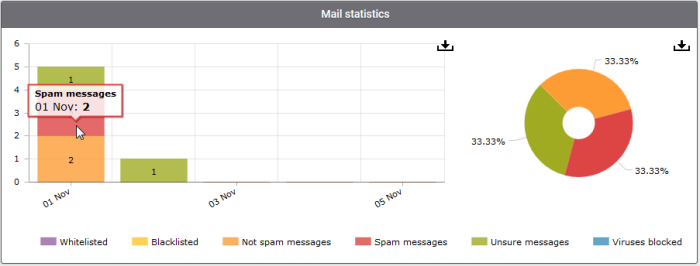
The 'Mails Statistics' area has charts to show blocked mails, blocked viruses and more.

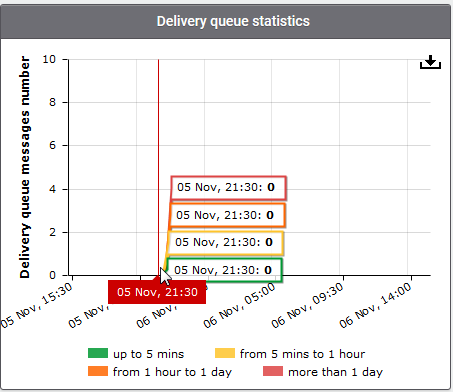
  • Place your mouse cursor over a graph to view more details.
  • Click on a legend item to add or remove it from a graph.
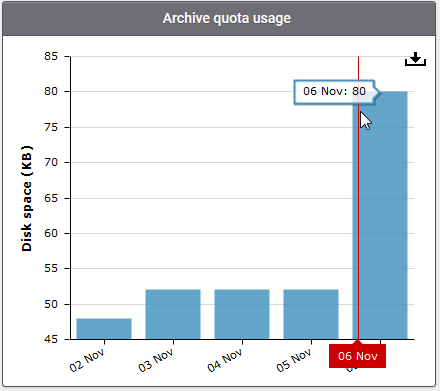


The 'Archive quota usage' area shows how much storage space has been used to archive incoming mails. The graph shows the disk space used per day for the last two weeks.

  • Place your mouse cursor over a graph to view the space used on a specific date. See Manage Archived Mails for more details.


  • The 'Delivery queue statistics' area provides details of filtered mails that are queued in CSEG servers for delivery at a later time.
  • It also displays the average time of queued mails for the previous day in CSEG servers before delivery. See Delivery Queue for more details.


Our Products
  • Free Antivirus
  • Free Internet Security
  • Website Malware Removal
  • Free Anti-Malware
  • Anti-Spam (Free Trial)
  • Windows Antivirus
  • Antivirus for Windows 7
  • Antivirus for Windows 8
  • Antivirus for Windows 10
  • Antivirus for MAC
  • Antivirus for Linux
  • Free Endpoint Security
  • Free ModSecurity
  • Free RMM
  • Free Website Malware Scanner
  • Free Device Manager for Android
  • Free Demo
  • Network Security
  • Endpoint Protection
  • Antivirus for Android
  • Comodo Antivirus
  • Wordpress Security
Cheap CDN
  • Bootstrap CDN
  • Semantic UI CDN
  • Jquery CDN
  • CDN Plans
  • CDN
  • Free CDN
Enterprise
  • Patch Management Software
  • Patch Manager
  • Service Desk
  • Website Down
  • Endpoint Protection Solutions
  • Website Security Check
  • Remote Monitoring and Management
  • Website Security
  • Device Manager
  • ITSM
  • CRM
  • MSP
  • Android Device Manager
  • MDR Services
  • Managed IT Support Services
  • Free EDR
Free SSL Certificate
Support Partners Terms and Conditions Privacy Policy

© Comodo Group, Inc. 2025. All rights reserved.