The Dashboard
The dashboard provides a snapshot summary of collected logs, events and incidents that were detected from customer networks for a selected period of time. This allows administrators to more effectively track customer progress, diagnose potential issues and to make informed decisions should corrective actions need to be taken. The default view shows the details collected for all enrolled customers. The administrator can filter the statistics for specific customer by selecting the customer from the left and for time periods ranging from last one hour to previous 24 hours by selecting the period from the drop-down at the top right.
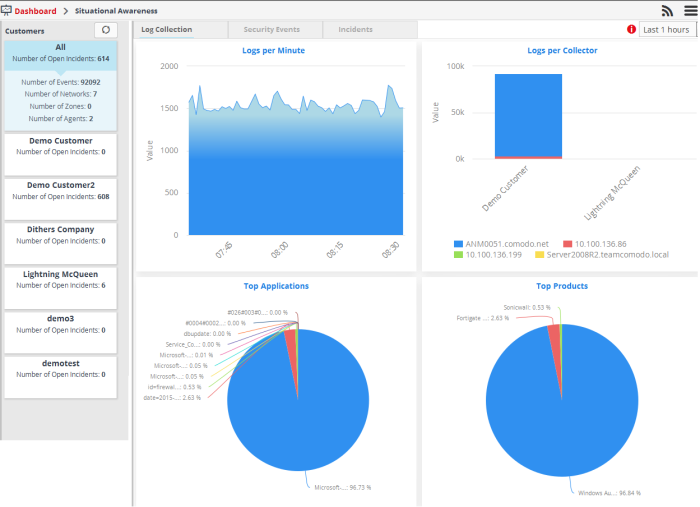
The 'Situational Awareness' dashboard contains three tabs, 'Log Collection', 'Security Events' and 'Incidents'.
- Log Collection - The Log Collection tab displays graphical summaries of number of logs collected from different networks, and applications and products running on the customer networks
- Security Events - The 'Security Events' tab provides critical information such as top 10 attack sources, top 10 attack destinations, top 10 firewall event sources and number of firewall events happened per minute.
- Incidents - The 'Incidents' tab provides details such as incident list, top 10 alerts, open incidents and unassigned incidents.
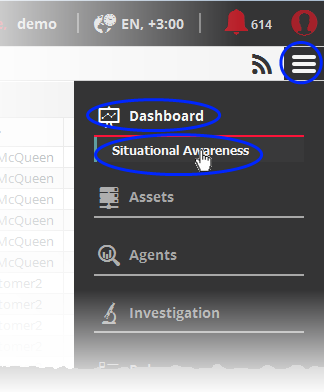
The 'Situational Awareness' Dashboard is displayed by default whenever you log-in to NxSIEM. To switch to the Dashboard interface from any other interface, click the 'Menu' button, choose 'Dashboard' from the options and click 'Situational Awareness'.
By default,
the statistics for all customers will be displayed.
Selecting Customer and Time Period
The left hand side menu displays a list of all the customers enrolled to NxSIEM with other details such as number of events, number of open incidents, number of networks, number of zones and number of agents for each customer. The top item in the list displays a consolidated summary of details from all the customers.
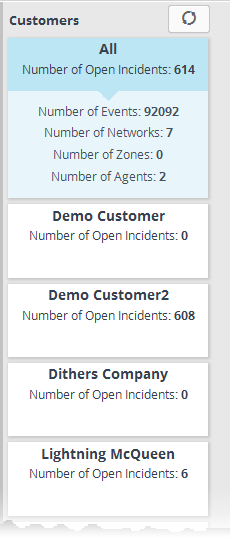
- To view the charts with details from all the customers on the dashboard, select 'All' from the list
- To view the charts pertaining to a selected customer on the dashboard, select the customer from the list
- To update the list of customers and number of events, click the refresh button at the top
The drop-down at the top left allows you to choose the time period for which the statistics are to be displayed. You can choose the time period from the last one hour to last 24 hours.
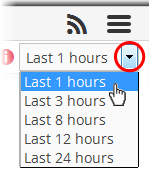
The dashboard will display the graphs for the selected customer with the details collected within the selected period.
|
Tip: In addition to the 'Situation Awareness' dashboard that displays the statistics of pre-defined parameters, the administrator can create custom dashboards specific to the customers, to display the results of event queries, as pie-charts, bar-charts and/or spider charts. The custom dashboards enable the administrator to view important details from often complex queries in an easily digested chart format and to effectively track, monitor and analyze the activities of their customers. Refer to the section 'Configuring Custom Dashboards' for more details. |
Following sections explain more on:
The 'Log
Collection' tab displays statistics of logs collected from the
selected customer networks as four charts, 'Logs per Minute', 'Logs
per Collector', 'Top Applications' and 'Top Products'. Comodo NxSIEM
gathers logs from various systems, tools and devices so that the data
may be searched, correlated and used to create reports.
Logs per Minute
The chart shows the number of logs collected from various sources in selected customer network at different time points.
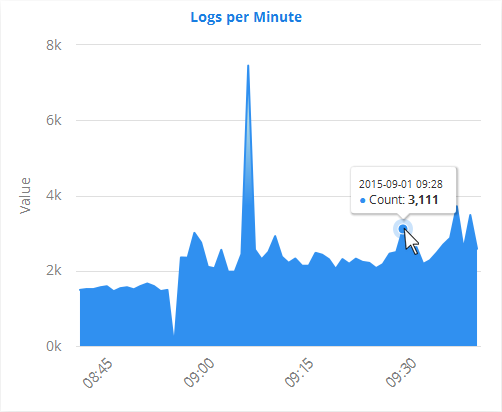
Placing the mouse cursor on the graph shows the exact number of logs collected at that time point as a tool tip.
Logs per Collector
The 'Logs per Collector' chart shows the number of log entries collected from different agents/networks pertaining to the selected customer's networks.
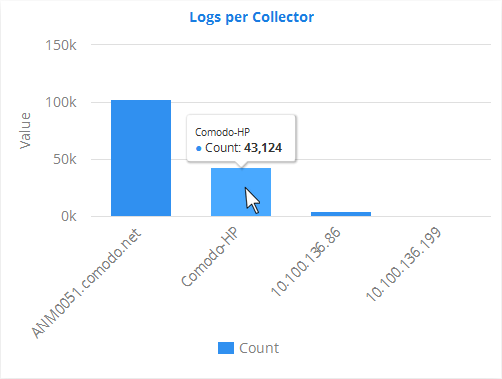
Placing the mouse cursor on a bar shows the exact number of the log entries collected from the respective agent as a tool tip.
Top Applications
The 'Top Applications' pie-chart shows the percentage breakup of number of log entries received from events generated by various applications running in the customer's network.
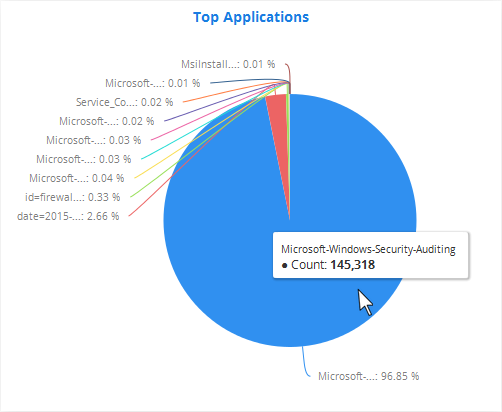
Placing
the mouse cursor on a sector shows the exact number of the log
entries collected from the respective application as a tool tip.
Top Products
The 'Top Products' pie-chart shows the percentage breakup of number of log entries of events generated by network appliances and firewalls connected to the customer's network.
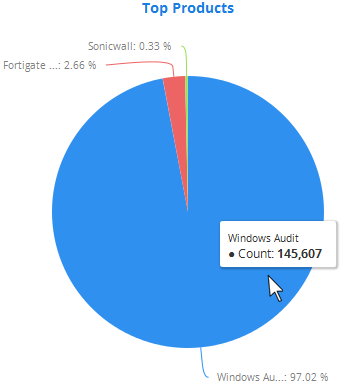
Placing the mouse cursor on a sector shows the exact number of the log entries collected from the respective product, as a tool tip.
The 'Security Events' tab in the dashboard displays summaries of events deteced from the customer networks as four graphs, 'Top Attack Sources', 'Top Attack Destinations', 'Top Firewall Event Sources' and 'Firewall Events Per Minute'. Comodo NxSIEM gathers logs from various systems, tools and devices so that the data may be searched, correlated and used to create these reports. The data is then analyzed automatically and graphs are displayed accordingly.
Top 10 Attack Sources
The bar graph displays the top attack events, from where the events originated and the type of attack events. The IP addresses of the systems from where the attacks came are displayed on the X-axis. Placing the mouse cursor over an event will display its details such as the event name and the number of times the attack event is generated from the source. The value in the Y-axis displays the number of attack events. You can hide/view a graph bar by clicking on the respective event name at the bottom. View all the attack event names by using the triangle buttons below it.

Top Attack Destinations
The bar graph
displays the top attack events, the type of attacks and the affected
systems. The IP addresses of the systems that were attacked are
displayed on the X-axis. Placing the mouse cursor over an event will
display its details such as the event name and the number of times
the system was attacked. The value in the Y-axis displays the number
of attack events. At the bottom of the graph, the attack event names
with color coding are displayed. You can hide/view a graph bar by
clicking on the respective event name at the bottom. View all the
attack event names by using the triangle buttons below it.

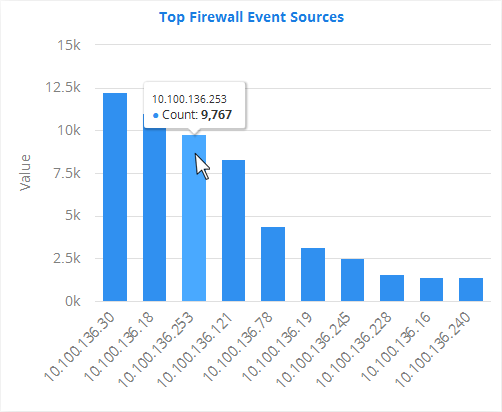
Top Firewall Event Sources
The bar graph displays the occurrence details of top 10 firewall events, for example, a block event, that occurred on the endpoints. The IP addresses of the systems from where the firewall events originated are displayed on the X-axis and the number of times the events occurred is displayed on the Y-axis. Placing the mouse cursor over an event source will display the number of times the event occurred on the system.
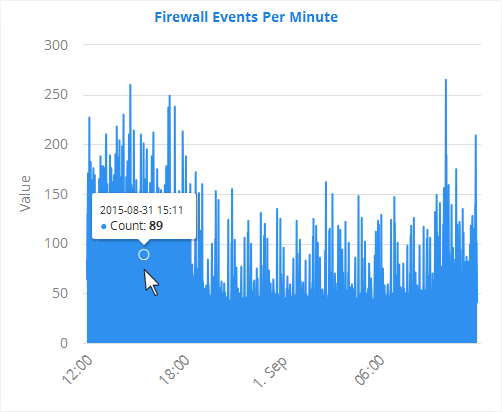
Firewall Events Per Minute
The bar graph provides occurrence details of firewall events on a per minute basis for better analysis. For example, administrators can get the time when the greatest number of firewall events occurs for a customer or if no events are coming from a customer, it may indicate malfunctioning communications with the agent or issue with log forwarding. Placing the mouse cursor over the graph will display the day, date, time and the number of times the event occurred.
- Click the 'Incidents' tab after selecting a customer from the left side.
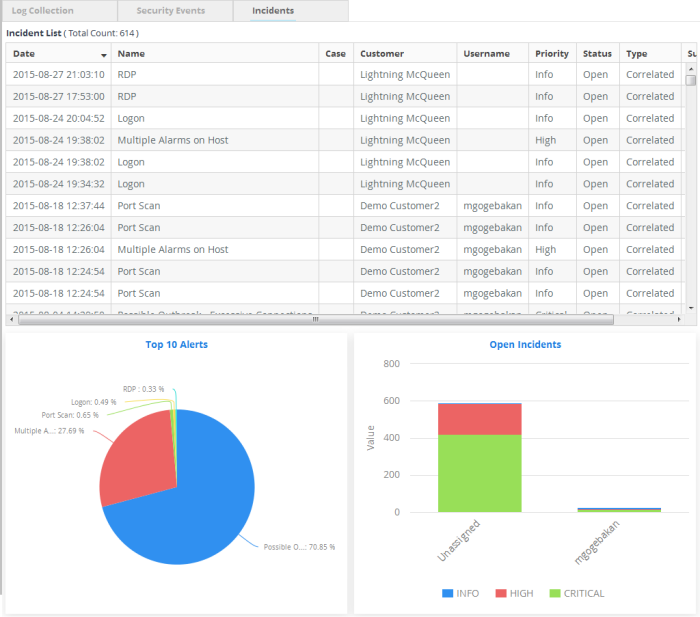
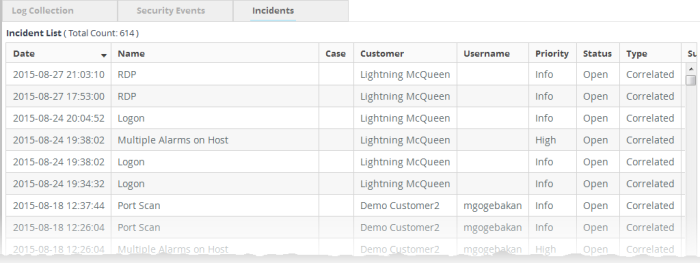
Incident List
The 'Incident List' table at the top displays a list of events with details like name, description and so on.
|
Incident List – Table of Column Descriptions |
|
|---|---|
|
Column Header |
Description |
|
Date |
Indicates the precise date and time of the incident. |
|
Name |
Displays the name of rule based on which the incident was detected or added. |
|
Case |
Displays the case to which the incident is integrated and assigned to the administrative user.. |
|
Customer |
The name of the customer |
|
Username |
Displays the username of the administrator to whom the incident is assigned. |
|
Priority |
Displays the option chosen in the 'Severity' drop-down of 'Rule Creation' screen and in the 'Priority' drop-down of 'Add Incident' screen. |
|
Status |
Displays whether the status of the incident is 'Open, In-Progress, False Positive or Closed' |
|
Type |
Indicates whether the incident is assigned automatically via alerts or added manually. Incidents assigned automatically are 'Correlated' type and those that are added manually are called 'Default' |
|
Summary |
Displays the a short description of the incident based on the description provided for the rule. |
You can sort the column items alphabetically/ascending or descending by clicking on the column header.
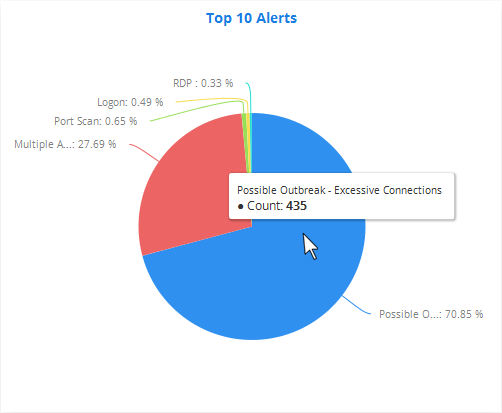
Top 10 Alerts
The pie chart displays the percentage breakup of rules based on which top 0 number of alerts were generated. Placing the mouse cursor over a sector displays the description of the rule and number of alerts generated for that rule.
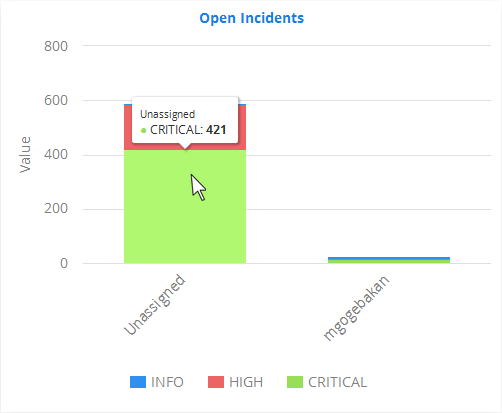
Open Incidents
The bar graph displays the numbers of incidents assigned to different administrative users and unassigned incidents. The X-axis displays the user details to whom the incidents are assigned and the Y-axis displays the number of incidents. Placing the mouse cursor over a graph bar will display the number of incidents, the severity of the incident and to which the user they are assigned.