


Managing Reports
Comodo NxSIEM is capable of generating detailed event reports covering a wide range of security and productivity criteria. Reports can be generated for periods ranging from one hour to one month and configured to be displayed as tables, pie charts and bar charts. The data for the reports are fetched from the event query results. You can use both pre-defined queries and custom queries added for a customer or event create new custom queries to generate reports as required. Refer to the section 'Query Management' for more details about configuring event queries.
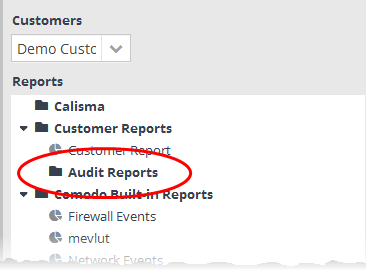
The Report Management interface allows the administrator to configure and generate reports for selected customers.
To open the Report Management interface, click the 'Navigational Menu' button from the top right, choose 'Reporting' from the options and then click 'Report Management.
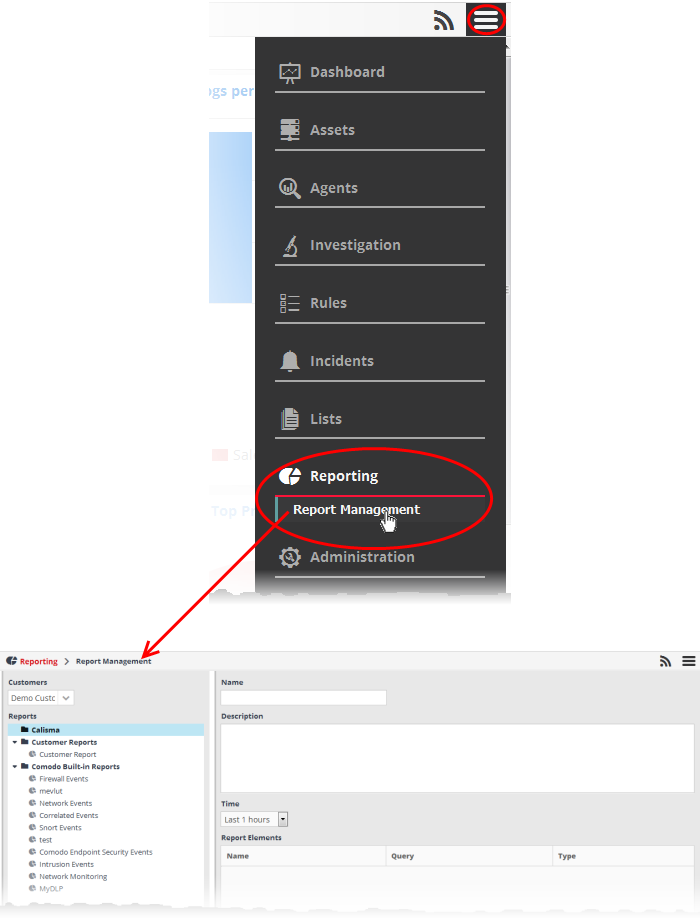
The left hand
side panel of the interface displays a list of predefined reports and
custom queries added for the selected customer under respective
category folders. The right hand side panel displays the
configuration area for report generation.
|
Report Management Interface – Table of Controls and Fields |
|
|---|---|
|
|
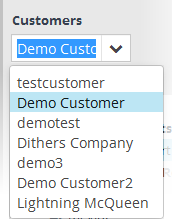
The 'Customers' drop-down allows you to select the customer for which you want to create or view the report(s). |
|
|
Allows you to add a new report category folder to the left side panel |
|
|
Allows to edit the name of a selected report category folder |
|
|
Allows you to add a new report type under a selected category folder |
|
|
Allows to delete selected report category folders or report type from the left hand side pane. |
|
Name |
Displays the name of the report chosen from the left hand side pane. Allows you to enter the name for the report, when creating a new report. |
|
Description |
Displays a brief description about the report chosen from the left hand side pane. Allows you to enter a brief description the for the report, when creating a new report. |
|
|
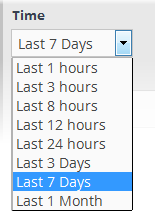
Allows you to select the time period for report generation. Options ranges from the last hour to the entire previous month. |
|
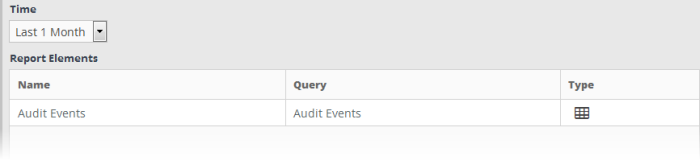
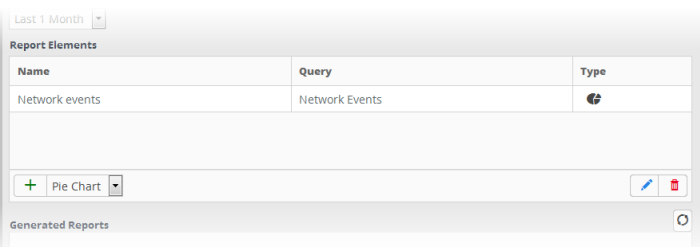
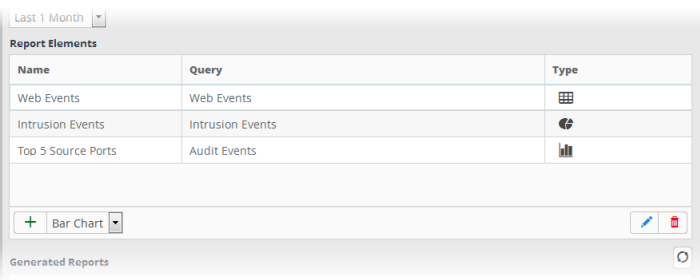
Report Elements |
Displays the list of contents in the report with details like their name, the event query based on which the data is populated in the report component and the type of the report component, like table, pie or bar chart. |
|
|
Allows you to add a report element to the selected report and choose the type of chart for the report element. |
|
|
Allows to edit a report element. |
|
|
Allows to delete a report element from the list. |
|
Generated Reports |
Displays the list of reports generated so far for the selected customer and allows you to download any report as a .pdf file. |
|
Show Last Generated Report |
On selecting this option, the last generated report for the customer is displayed. |
|
|
Allows you to instantly generate the selected report. |
|
|
Allows you to specify the automatic generation of the selected reports according to a schedule of your choice |
|
|
Allows to save a configured report. |
Following sections explain on:
Manage a Reports Category Folder
Each report
folder contains a collection of reports of a specific category. Every
new report configured, must always be placed in a category folder.
Creating a reports group folder
- Choose the customer from the 'Customers' drop-down at the top of the left panel.
A list of predefined reports added for the customer is displayed as a tree structure in the 'Reports' pane.
-
Choose the parent folder to create a new sub-folder and click the
 button. The Folder Name dialog will appear.
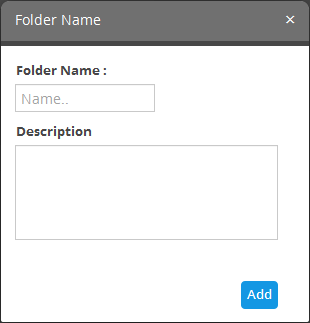
- Enter a name for the new folder in the 'Folder Name' field
- Enter a description for the folder
- Click the 'Add' button
The folder will be saved and displayed on the left side.
The relevant
reports can now be placed under the newly created folder. Refer to
the 'Adding and Configuring a
Report' for more details.
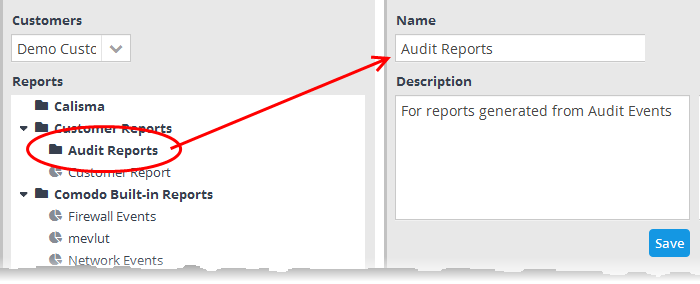
Editing a reports group folder
- To
edit the name of a reports group folder, select it and click the
 button.
The 'Folder Name' dialog will appear.
- Edit the name and/or the description as as required and click the 'Save' button
Alternatively, click on the folder, edit the details on the right side and click the 'Save' button.
Deleting a reports group folder
- To
delete a reports group folder, select it and click the
 button.
A confirmation dialog will appear.
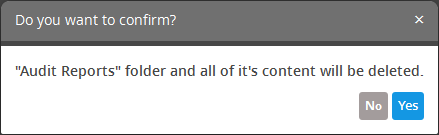
- Click
'Yes' in the In the confirmation dialog. Please note all reports
contained in the folder will also be deleted.
Comodo NxSIEM
ships with a set of pre-defined reports which are listed under the
'Comodo Built-in Reports' folder in the left hand side panel of the
'Report Management' interface. The interface also allows the
administrator to configure custom reports for various categories of
events for selected customer and save them under the respective
category folder. The reports can be generated at anytime as and when
required for the customer.
To add a new report for a customer
- Choose the customer from the 'Customers' drop-down at the top of the left panel.
A list of predefined reports added for the customer is displayed as a tree structure in the 'Reports' pane.
- Select the appropriate folder or create a new folder under which you want to create a report.
- Click
the
 button
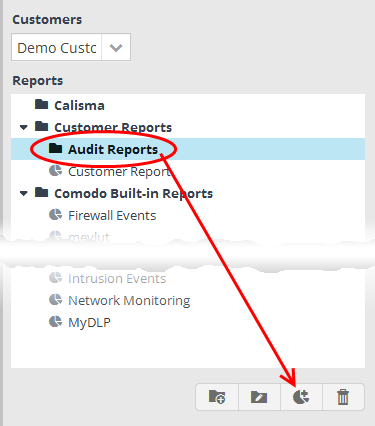
The configuration screen for creating the new report will be displayed in the right hand side panel. It has four areas:
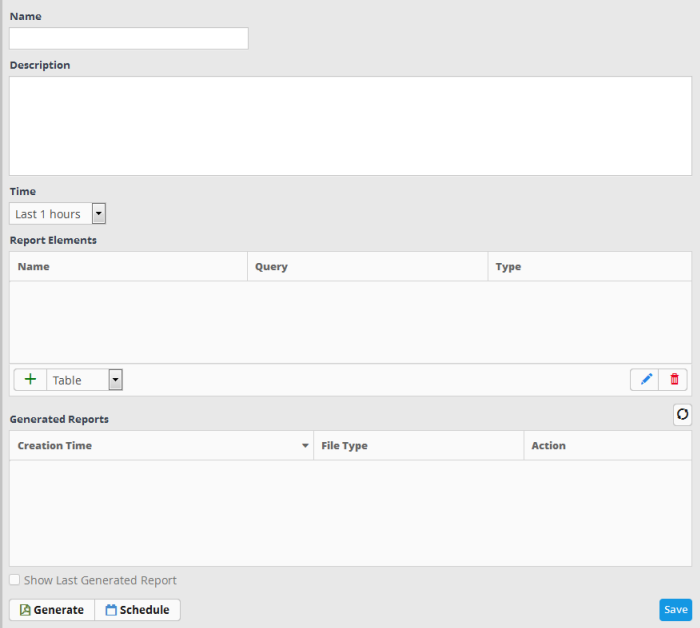
- Enter a name for the report in the 'Name' field
- Enter an appropriate description for the report in the 'Description' text box
- Select the period for which the events are to be included in the report, from the 'Time' drop-down
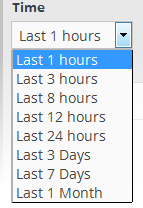
The period
options range from last one hour to the entire previous month of the
report generation time.
The next step is to add the component tables/charts to be included in the report. The events for populating the tables/charts are fetched from the query results. Refer to the section 'Query Management' for more details about configuring event queries.
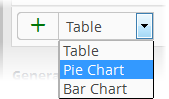
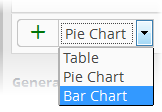
- Select the type of report element that should be added, from the drop-down at the bottom of the 'Report Elements' area.
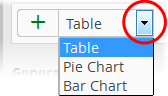
The options available are:
- Table - The report component will contain the details of the events that match the query selected. Refer to the explanation on adding a table given below, for more details.
- Pie Chart - The report will contain a pie-chart showing the statistical summary of the events that are aggregated based on parameters configured for the chart. Refer to the explanation on adding a pie chart given below , for more details.
- Bar chart - The report will contain a bar-chart showing the statistical summary of the events that are aggregated based on parameters configured for the chart. Refer to the explanation on adding a bar chart given below , for more details.
The Table Type report is configured just by selecting the event query from the list of queries added for the customer. The resultant report will contain all the details of the events that match the query, detected within the selected time period, displayed as a table.
To add a Table type report
- Select
'Table' from the drop-down and click the
 button beside it.
The
configuration dialog for adding a report table will appear with a
list of all event queries configured for the customer.
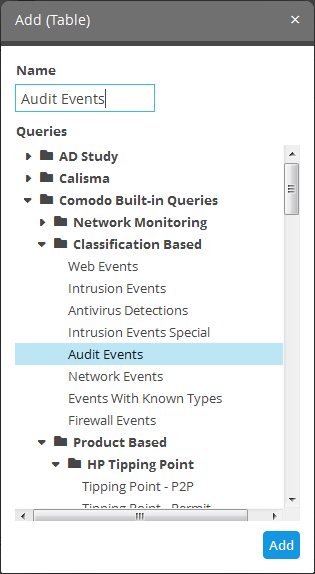
- Enter the name for the report element in the 'Name' field.
- Select the event query for which you want to generate a report in table format. This table is the same as configured in the event queries.
- Click the 'Add' button.
The report element will be added to the report.
'Pie Chart' type and Bar Chart Type Report Elements
The chart type reports can be configured by specifying the following parameters:
- Event Query – The query whose results are to be displayed in the chart. The query can be selected from the list of queries, added fro the selected customer. The events that are detected based on the query for the last one hour will be displayed in the charts.
- Group By – The field, based on whose values, the events identified by the query are to be grouped and shown in the chart. Event groups will be formed so that each event group will have events with same value for the selected field.
- Aggregation Function - The event groups formed based on the fields chosen in the 'Group by' option, are ranked based chosen 'Aggregation Function'. The event groups are indicated in the charts in ascending or descending order as chosen in the 'Order by' setting. The available options are:
- Count - The event groups are ranked based on the number of events in each group. For example, if you choose Source IP as 'Field' then the group which contains the most events on a particular source IP will have the top rank and the group containing the lowest number of events is ranked lowest. You can further control how the data is displayed by modifying the ‘Order By’ and ‘Limit’ parameters.
- Sum - The event groups are ranked based on sum of values in another field that contains numerical value. If you choose 'Sum', you need to select another field that contains a numerical value, like bytes in/out. The event groups are ranked based on the sum of the values in the chosen numerical field from all the events in that group. For example, if we choose 'Bytes-in' as numerical value, then the system adds up the values in the 'Bytes-in' field of all the events in a group and ranks the group accordingly. This will tell you which source IP has the most incoming traffic. The event group with the highest SUM in the 'Bytes-in' field is ranked top and vice-versa.
- Average - Similar to above. Event groups are ranked based on the average of the values of the chosen numerical field from all the events in that group. (e.g. the average of values of 'Bytes_in' field of events in the group, if we take the same example as above)
- Minimum - Similar to above. The event groups are ranked based on the minimum of the values of chosen numerical field from all the events in that group.
- Maximum - Similar to above. The event groups are ranked based on the maximum of the values of chosen numerical field from all the events in that group.
- Order By – You can choose the order in which the event groups are to be indicated in the chart, based on their ranking. The available options are:
- Ascending – The group with the lowest rank will be top of the list. A limit of 5 will show the 5 groups with the lowest ranks.
- Descending – The group with the highest rank will be top of the list.. A limit of 5 will show the 5 groups with the highest ranks.
- Limit – The number of event groups to be displayed in the chart
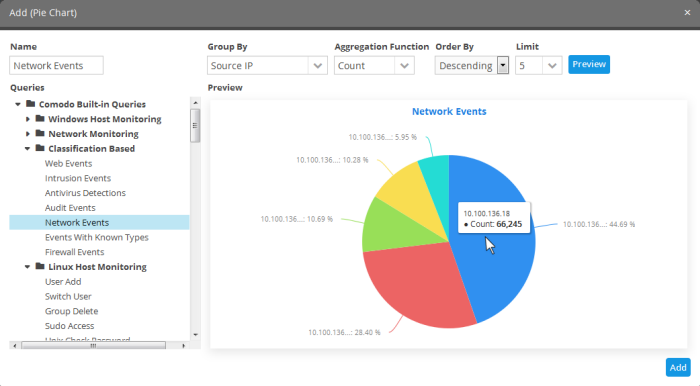
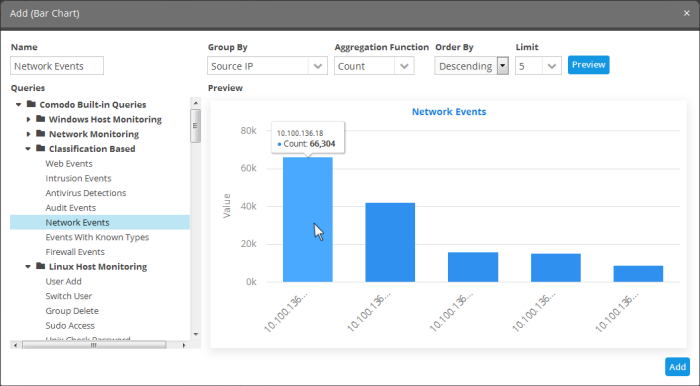
The following screenshot shows the preview of resulting pie chart from the following configuration parameters:
'Network Events' + 'Source IP' + 'Count' + 'Descending' + '5'
The following sections explain on:
To add a Pie Chart type report
- Select
'Pie Chart' from the drop-down and click the
 button beside it
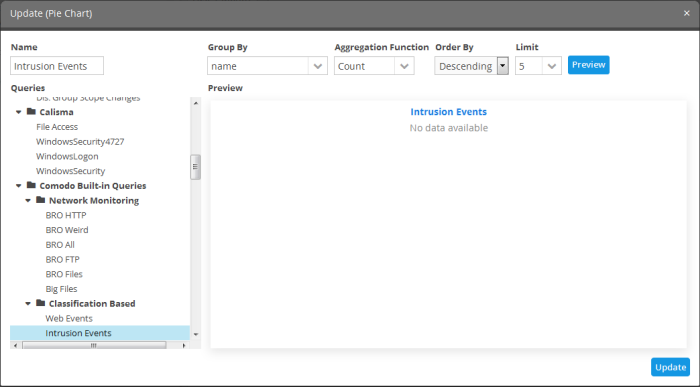
The
configuration dialog for adding a report pie chart will appear with a
list of all event queries configured for the customer at the left.
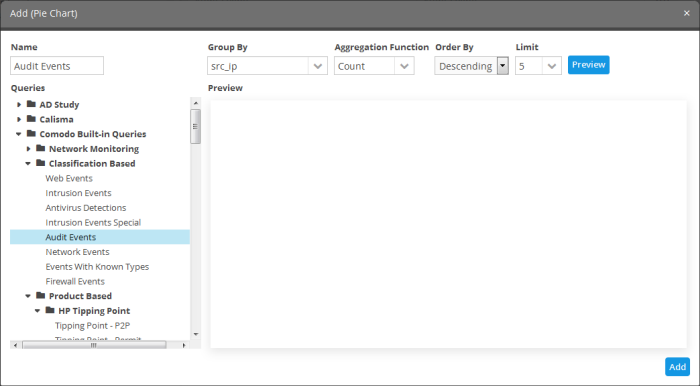
|
Add (Pie Chart) – Form Parameters |
|
|---|---|
|
Parameter |
Description |
|
Name |
Enter an appropriate name for the report element |
|
Queries |
Displays the list of predefined and custom event queries added for the selected customer. Select the event query for which the results are to be displayed in the chart. |
|
Group By |
The drop-down displays the fields, configured as event query results table column headers for the selected event query. Refer to 'Configure results table for a query' for more details. Choose the Field based on whose values, the events identified by the query are to be grouped and shown in the chart. |
|
Aggregation Function |
Allows you to choose the aggregation operation to be applied for ranking the event groups and show them in ascending or descending order, in the chart. The options available are:
|
|
Order By |
Allows you to choose the order in which the event groups are to be indicated in the chart, based on their ranking. The available options are:
|
|
Limit |
Enter the number of events to be displayed for the chart. |
|
Preview |
This button allows to preview the chart before adding it to the report. |
|
Add |
Click this button to add the chart to the report. |
- Enter the parameters for the chart as shown in the table above and click the 'Preview' button to check the chart before adding it to the report.
- Click the 'Add' button
The configured report element will be added to the list.
To add 'Bar Chart' type report element
- Select
'Bar Chart' from the drop-down and click the
button beside it
The procedure is same as adding
a pie chart report element explained above.
- Click the 'Add' button
The configured report element will be added to the list.
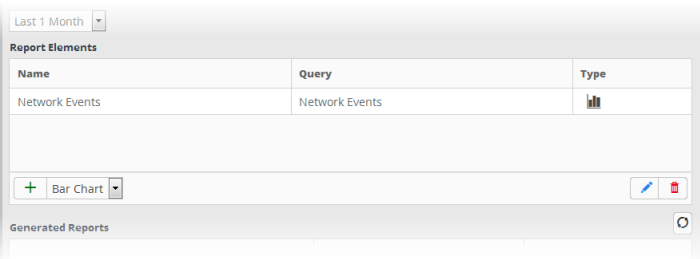
The 'Report Elements' area
displays the list of report components added to the report.
- Name - Displays the name of the report element
- Query - Displays the name of the event query that was used to configure the report element
- Type - Indicates the type of report element, whether table, pie or bar chart.
You can add as many report elements as required for a report.
- Click the 'Save' button to save all the report elements.
Now that you have configured a report, you can generate the report and/or schedule the report generation.
After configuring a report, you can generate it manually or specify the automatic generation of the report according to a schedule of your choice.
To manually generate a report
- Choose the customer from the 'Customers' drop-down at the top of the left panel.
A list of predefined and custom reports added for the customer is displayed as a tree structure in the 'Reports' pane.
- Select the report from the list.
The details of the report with the list of report elements will be displayed in the configuration area at the right.
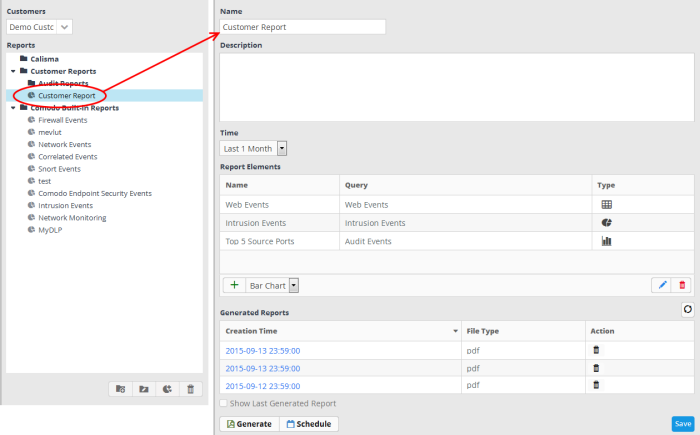
The 'Generated Reports' area displays a list of reports generated manually or as per the schedule created for the report.
- Creation Time - The date and time the report was generated.
- File Type - Currently only PDF format is available for reports. Future releases will support RTF files also.
- Action - Allows to delete the generated report.
- To generate the report instantly, click the 'Generate' button.
The report generation will be started and on completion, it will be added to the list under 'Generated Reports' and its time stamp will be added to the 'Creation Time' column.
- To download the report, clicking the time stamp under the 'Creation Time' column.
- To view the report instantly select the 'Show Last Generated Report' check box.
Refer to the section 'Download / View a Report' for more details about how to download and /or view a report.
You can automate the process of report generation
according to a schedule of your choice.
To schedule a report generation
- Choose the customer from the 'Customers' drop-down at the top of the left panel.
A list of predefined and custom reports added for the customer is displayed as a tree structure in the 'Reports' pane.
- Select the report from the list.
The details of the report with the list of report elements will be displayed in the configuration area at the right.
- Click the 'Schedule' button at the bottom of the 'Generated Reports' area.
The 'Schedule Report' dialog will be displayed.
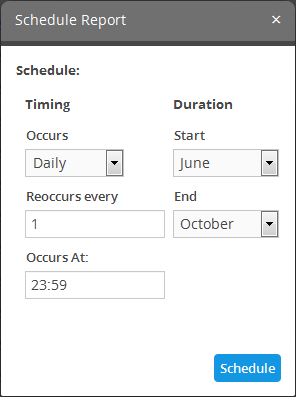
The 'Timing' section allows you to define the frequency for report generation.
- Occurs: Select the period for report generation from the drop-down. The options available are:
- Hourly
- Daily
- Weekdays
- Weekend
- Weekly
- Monthly
- Reoccurs every: Enter the frequency for report generation as per the chosen days. For example, if you select 'Daily' and enter 2, then the agent will collect the logs once in every 2 days
- Occurs At: Enter the exact time at which the report is to be generated at the set days.
- Start: Select the start month from the drop-down
- End: Select the end month from the drop-down
- Click the 'Schedule' button.
The 'Generated Reports' area in the 'Report Management' interface allows you to download and / or view any generated report.
To download / view a report
- Choose the customer from the 'Customers' drop-down at the top of the left panel.
A list of predefined and custom reports added for the customer is displayed as a tree structure in the 'Reports' pane.
- Select the report from the list.
The details of the report with the list of report elements will be displayed in the configuration area at the right.
The 'Generated Reports' area displays a list of reports generated manually or as per the schedule created for the report.
-
To download a report, click on the time stamp link of it under the 'Creation Time' column.

You can download the report in .pdf format.
-
To view the last generated report instantly, select the 'Show Last Generated Report' check box.
The report will be displayed in the 'Last Generated Report' area, below 'Generated Reports' area.
You can change the name, description, report elements and their configuration at any time from the Report management interface.
To edit a report
- Choose the customer from the 'Customers' drop-down at the top of the left panel.
A list of predefined and custom reports added for the customer is displayed as a tree structure in the 'Reports' pane.
- Select the report from the list.
The details of the report with the list of report elements will be displayed in the configuration area at the right.
- Edit the name and description as required and click the 'Save' button at the bottom.
To edit the details of a report element
- Select the report element from the list that you want to edit and click the edit button at the bottom.
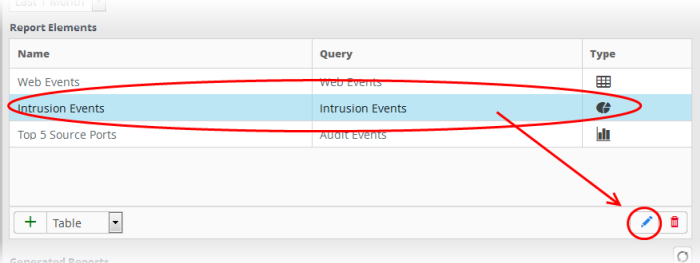
The 'Update' screen for the selected report element will be displayed.
- Edit the details of the report element as required. The procedure is similar to adding a report element as explained above.
- Click the 'Update' button.
- Click
the 'Save' button at the bottom.
To delete a report element
-
Select the report the element and click the delete button at the bottom
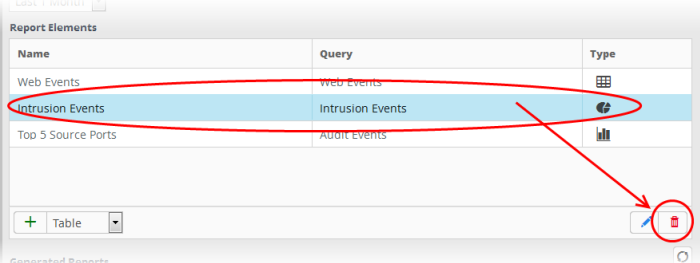
The report element will be deleted.
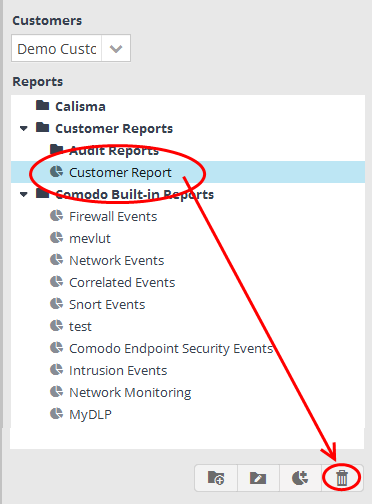
To delete a report
- Select the report on the left side and click the delete button at the bottom.
In the confirmation dialog, click the 'Yes' button to remove the report.
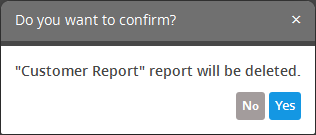
The report and all the report elements under it will be deleted.
The 'Generated Reports' area in the Report Management interface displays a list of manually generated and scheduled report files for the report selected from the left.
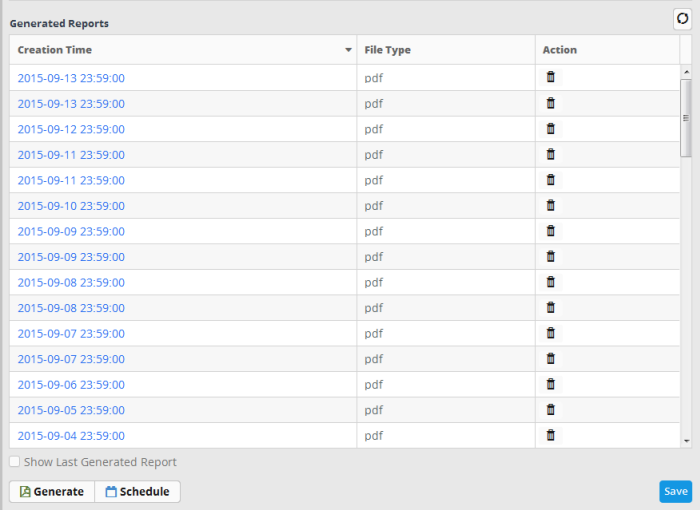
- To sort the generated report list according to the date from latest to earliest and vice-versa, click anywhere on the 'Creation Time' column header.
- To
refresh the list of generated reports, click the button
 on the right.
- To view the report that was generated last, select the 'Show Last Generated Report' check box
The report will be displayed below the section.
- To close the report, deselect the 'Show Last Generated Report' check box
- To
delete a report file, click the thrash can icon
 under the 'Action' column
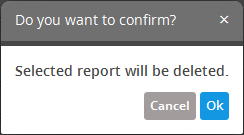
- Click the 'Ok' button to confirm the deletion of the report.