View Properties of a Process
- Open CCE > right-click on a process > select 'Properties'
- The 'Properties' interface is divided into 11 separate tabs, each containing important information about a process.
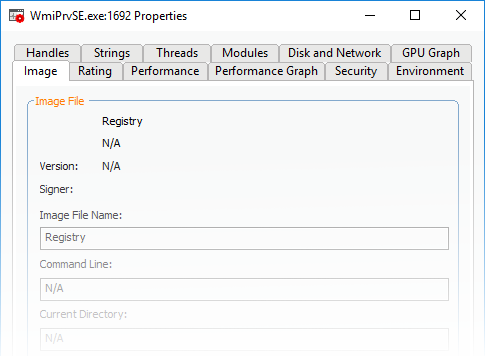
Click the following links for more details on each tab:
The image tab shows the basic information about the process and its image file. You can also view its command line, Data Execution Prevention (DEP) status, terminate the process and so on. The dialog also allows you to make the Window of the parent application of the process active and to terminate the process.
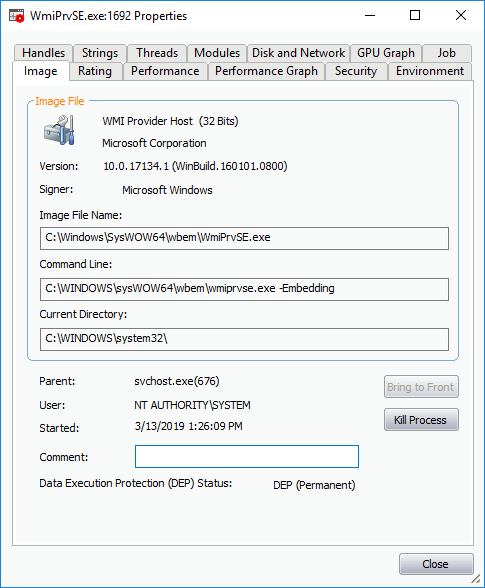
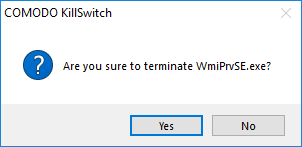
- Terminate - Click 'Kill Process' to stop the process. Confirm termination before stopping the process by clicking 'Yes' in the confirmation dialog.
Click here to go back to list of properties
The rating tab shows a list of scanning tests performed by KillSwitch on the process through its native scanner, CAMAS and the results pertaining to each scan.
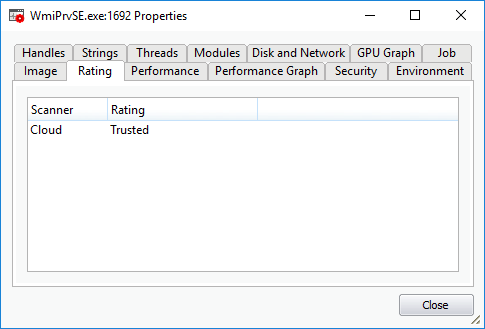
You can see the following scan results:
|
Scan Result |
From |
Notes |
|---|---|---|
|
Basic |
File scanner of local AV engine |
To ensure the most accurate scan results, please update the AV database prior to running an AV scan. |
|
FLS |
Cloud based file scanner |
- |
|
Cloud based verification of a file's digital signature |
- |
|
|
Local verifier of trusted vender Local check that the creator of the file is on the trusted vendor list |
Checks that the file has a digital signature. If it does, then checks this signature is in the trusted vendor list. |
|
|
CAMAS |
File is uploaded to Comodo Automated Malware Analysis System (CAMAS) for inspection |
Use private communication protocol to send the file to CAMAS for analysis. Public CAMAS URL: http://camas.comodo.com/ |
The rating list shows the final rating only according to the priorities. The priority of scan results are the following (High to low):
-
Basic.Malware
-
FLS.Malware
-
FLS.Trusted
-
CAMAS.Detected
-
CAMAS.Malware
-
CAMAS.Suspicious
-
CAMAS.SuspiciousP
-
CAMAS.SuspiciousPP
-
FLS.Unknown
-
FLS.Absent
Click here to go back to list of properties
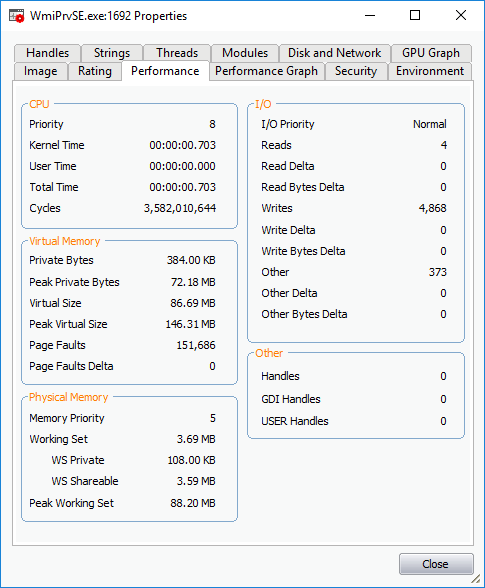
The performance tab shows the statistics and performance information like CPU usage, I/O activity, memory usage etc. This data can help advanced users track the resource overhead of a process at a granular level.
Click here to go back to list of properties
The performance graph tab represents three graphs of the process' performance - CPU Usage, Private Bytes, and I/O activity. This window helps the advanced users to monitor the resource overhead of a process pictorially. You can hover your mouse over the graphs to view details.
Click here to go back to list of properties
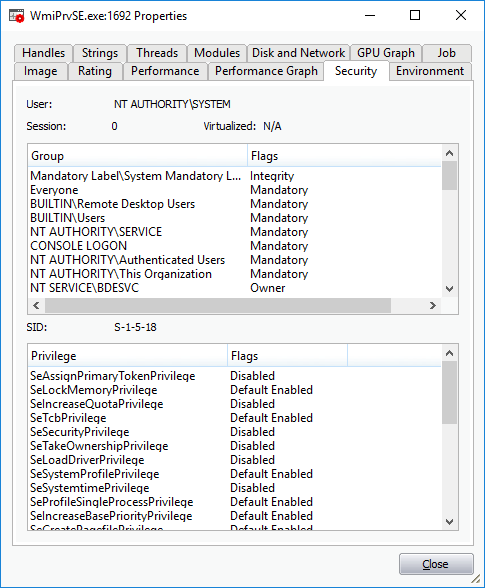
The security tab displays the primary tokens of the process. The primary token of a process is an object which describes security attributes such as the user, groups and privileges.
Click here to go back to list of properties
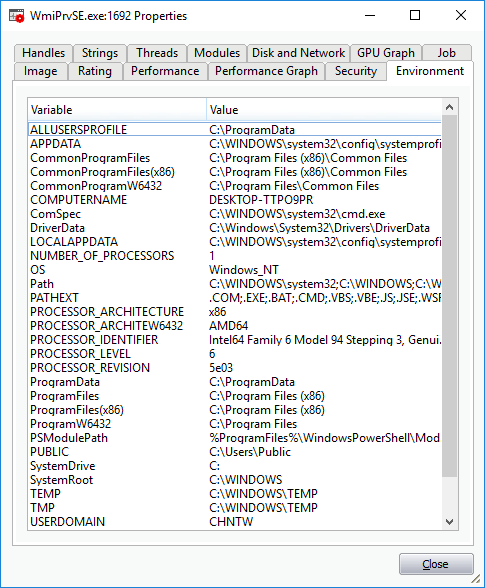
The environment tab displays the process' environment variables, which are the variables accessible to process describing the operating system environment. Environment variables are normally inherited by child processes.
Click here to go back to list of properties.
Handles
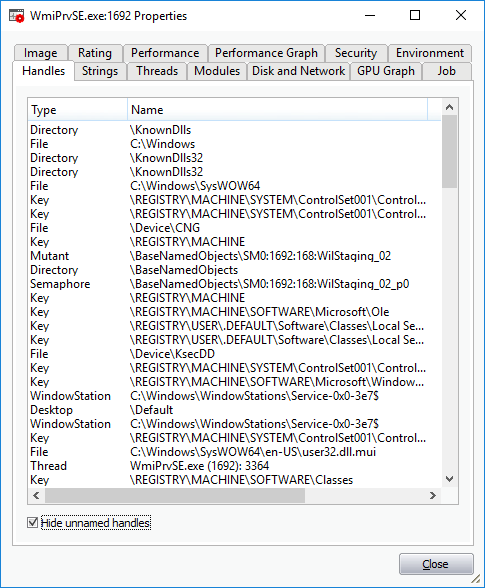
The handles tab displays the process' handles - resources it has opened. A handle refers to the value used to uniquely identify a resource,such as a file or a registry key, accessed by the process or the application.
|
Tip: The columns displayed in 'Handles' interface can be configured to display the details as required. See Column Selection > Handles for more details. |
- Hide unnamed handles - Selecting this option removes the handles that do not have a name from the list of handles displayed.
- Right-clicking on an handle opens a context sensitive menu that enables to you to close or view the properties of the handle.

- Close Handle - Closing a process handle does not terminate the associated process or remove the process object.
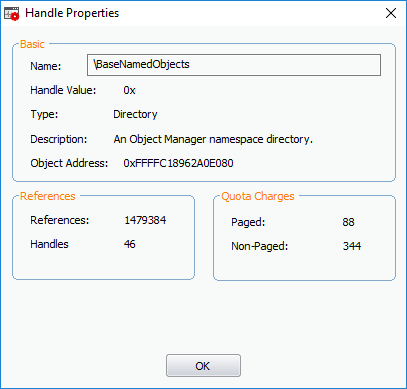
- Properties - Opens the 'Handle Properties' dialog. Also you can open this dialog by double-clicking a handle.
Click here to go back to list of properties
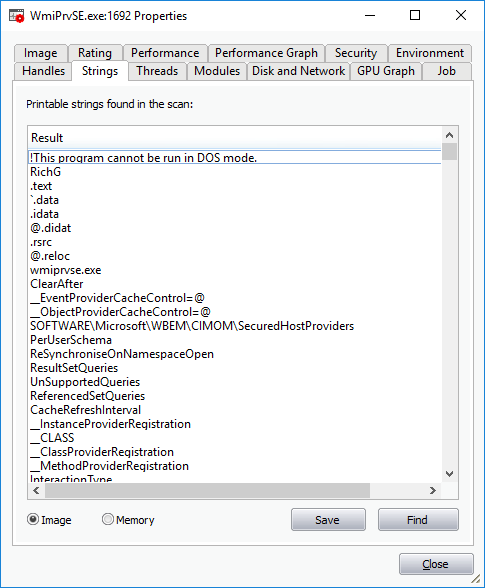
The strings tab shows a list of ASCII and Unicode strings that are loaded to the process. You can choose to extract the threads loaded to process image or process memory.
-
Select ‘Image’ or ‘Memory’ to extract and view the strings from Process Image or the Process Memory respectively.
- Click 'Save' to store a copy of the list of strings as a text file.
Click here to go back to list of properties.
Threads
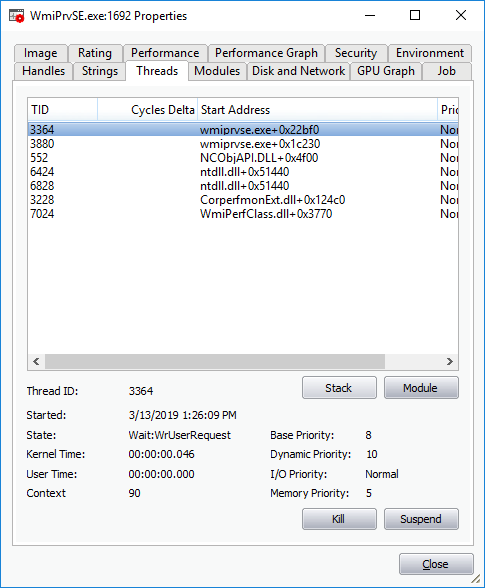
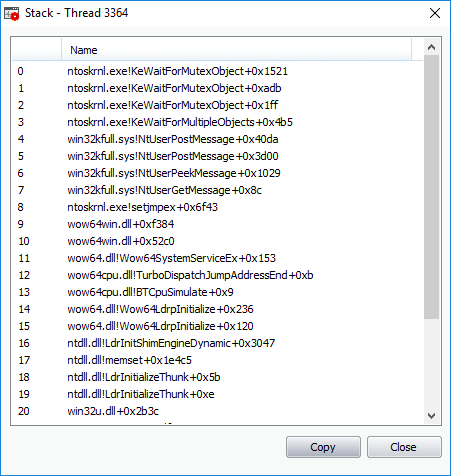
The threads tab shows child processes started by the process, including their symbolic start addresses. You can click on a thread to view more information, or double-click a thread to view its call stack.
Handle Threads
-
Stack - Analyzes the thread and displays a list of stacks in the thread.
-
Module - Opens the 'Properties' dialog of the module that has invoked the process.
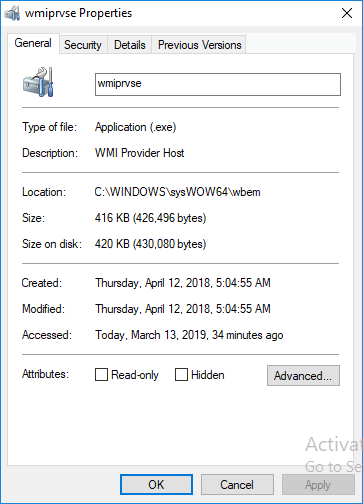
- Kill – Terminates the thread. Terminating the thread does not stop the associated process or remove the process object.
- Suspend – Temporarily stops the thread.
Click here to go back to list of properties
Modules
The
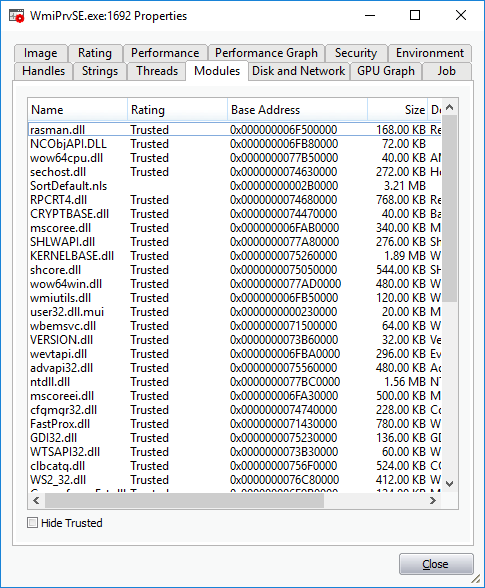
modules tab displays the executable files(DLL files) loaded by the
process. Modules are the dynamic link library (DLL) files that
are loaded to the system memory by the selected process.
You can also open this window by double clicking on a module that
opens its 'Properties' dialog.
|
Tip: The columns displayed in Handles interface can be configured to display the details as required. See Column Selection > Module for more details. |
-
Hide Trusted - Removes DLL modules identified as trusted by KillSwitch and displays only unknown and untrusted modules.
Handle the Modules
Double-clicking on one of the modules open the 'Properties' dialog of the module.
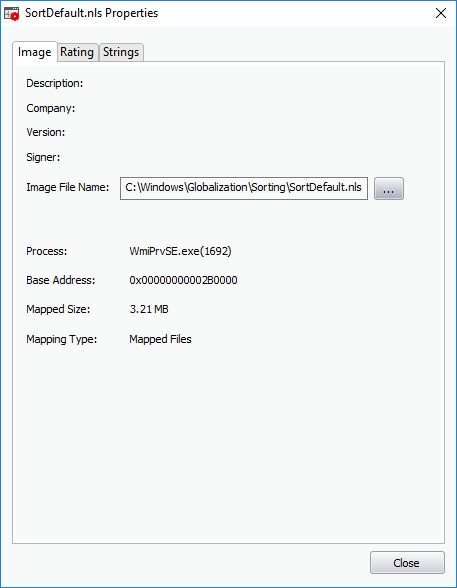
The dialog provides complete details of the DLL module in three tabs 'Image', 'Rating' and 'Strings'.
Right-clicking on a module listed opens a context sensitive menu that enables you to perform various actions like unloading the module from the memory.
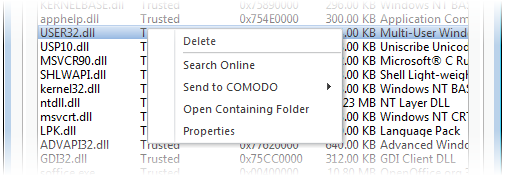
- Delete - Removes the selected module from your computer. You need to confirm before deleting the module.
|
Warning: Deleting some critical modules of an application may render the application unusable. |
- Search Online - Opens the default web browser with the specified search engine and searches for information on the module.
- Send to Comodo - Submits the module for analysis to Comodo as Suspicious or False Positive. The files will be analyzed by experts and added to white list or black list accordingly.
- Open
Containing Folder -
Displays
the folder in which the module
is stored, through 'Windows Explorer'.
- Properties - Shows the 'Properties' dialog of the module.
Click here to go back to list of properties
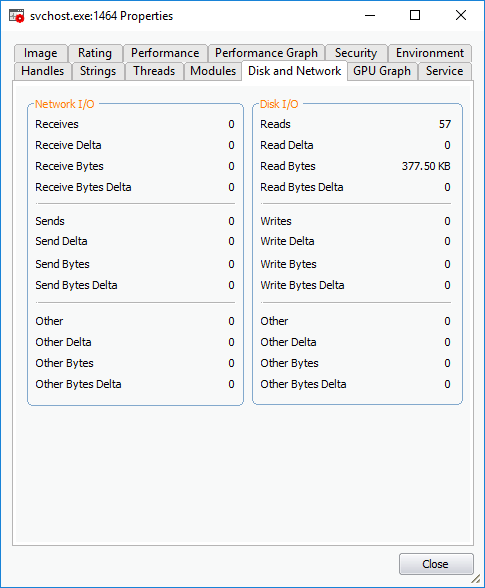
The disk and network tab contains two areas which display a range of network and disk I/O (input/output) statistics per program.
Click here to go back to list of properties
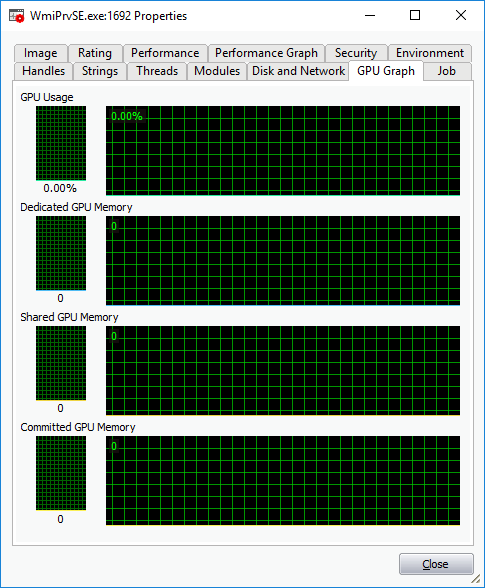
The GPU graph represents four graphs of the graphical memory process' performance - GPU Usage, Dedicated GPU Memory, Shared GPU Memory and Committed GPU Memory. This window helps the advanced users to monitor the resource overhead of a process pictorially. You can hover your mouse over the graphs to view details.


