View System Information
- The system information pane shows the dynamic graphical representations of your CPU usage, I/O activity and physical memory usage of your system.
- It also shows the detailed statistics on current utilization of various system resources.
- Click 'View' > 'System Information', to view the system information pane.
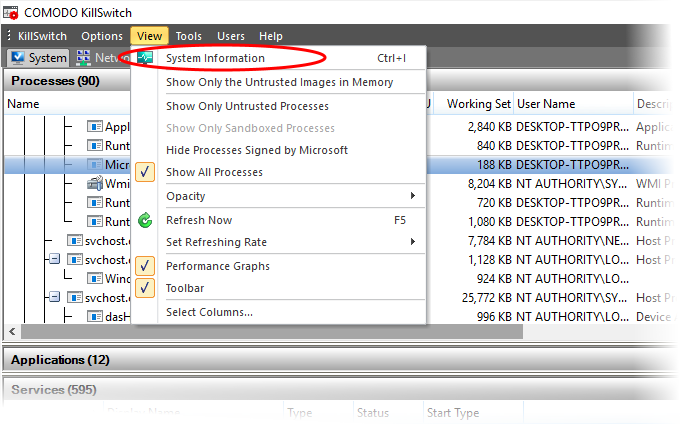
-
Alternatively, click the 'System Information' icon
 from the tool bar.
The 'System Information' dialog opens at the 'Summary' tab:
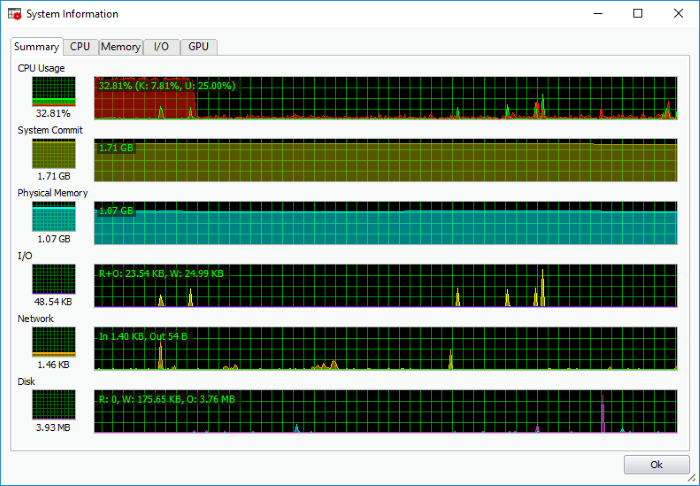
The
'Summary' tab:
- CPU - Shows a dynamic graphical representation of the usage of CPU over time. In multiprocessor operating system, you can make the pane display individual graph for each CPU by selecting the otption 'Show one graph per CPU' at the bottom left of the interface.
- System Commit - Shows a dynamic graphical representation of performance system commit.
- Physical Memory - Shows a dynamic graphical representation of the usage of physical system memory over time.
- I/O - Shows a dynamic graphical representation of Input/Output activities of the computer over time.
- Network - Shows a dynamic graphical representation of how much network traffic is used over time by services and applications running on your computer.
- Disk - Shows a dynamic graphical representation of disk usage. You can hover your mouse over the graph to view details.
The 'CPU' tab:
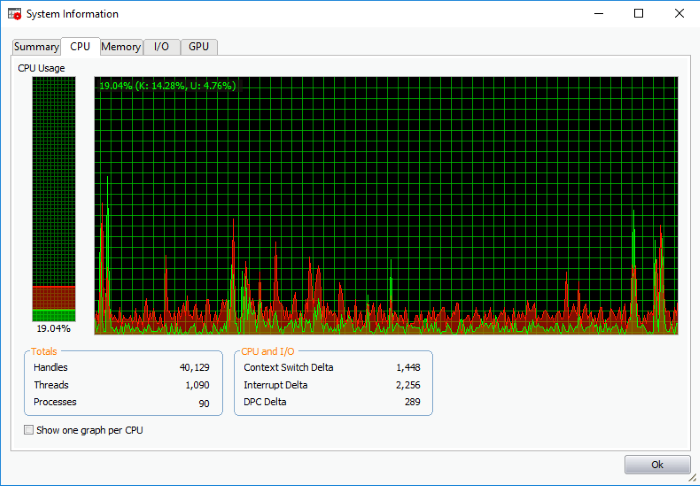
-
Totals - Shows a detailed statistics on the number of processes, threads and handles that run on the computer.
- CPU and I/O - Shows a statistical report on the CPU activities and Input/Output activities of your computer.
-
Show one graph per CPU - If enabled, displays individual graphs for each processor in a multiprocessor operating system. Hence this option will be enabled only in multiprocessor operating system environment.
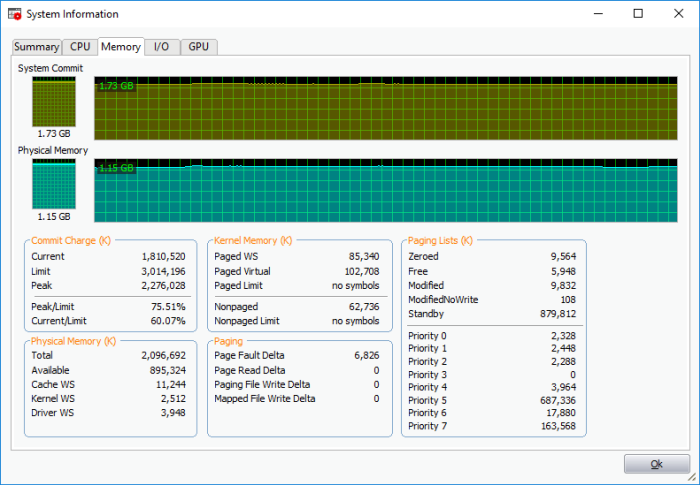
-
Commit Charge - Displays a statistics on virtual memory allocated to programs and the operating system in KB. As the memory is copied to the paging file(s) in you hard disk drive, the peak value listed under Peak may exceed the maximum physical memory.
- Current – Shows the current amount of the system commit charge
- Limit – Indicates the amount of physical memory and size of all paging files combined. This is the maximum total memory size which the system is allocated
- Peak – Displays the maximum amount of the system commit charge since the last reboot the operating system
- Peak/Limit – The percentage the peak of the system charge comparing to the system commit limit since the last reboot
- Current/Limit - The percentage of the current value of the system commit charge comparing to the current value of the system commit limit
- Physical Memory - Shows statistics on the total physical memory, also called RAM, installed on your computer in KB.
- Total - Represents the amount of total Physical Memory.
- Available - Represents the amount of free memory that is available for use.
- System Cache - Shows the current physical memory used to map pages of open files.
- Kernel - Shows the current kernel-mode time usage.
- Driver - Shoes the kernel-mode drivers that are in currently enabled on the system.
-
Kernel Memory - Shows a statistical report on memory used by the operating system kernel and device drivers in KB.
- Paged Virtual - Memory that can be copied to the paging file from virtual memory.
- Paged Physical - Memory that can be copied to the paging file from physical memory, thereby freeing the physical memory. Operating system uses physical memory.
- Nonpaged - Memory that remains resident in physical memory and are not copied to the paging file.
- Nonpages limit – The current maximum memory that remains and are not copied to the paging file
-
Paging - Shows a statistical report on the page faults, The page fault is the direct access to the page that is mapped in the virtual memory but not loaded in the physical memory.
- Paging Limits - The current maximum of page fault mapped in the virtual memory but not loaded in the physical memory in KB.
The 'I/O' tab:
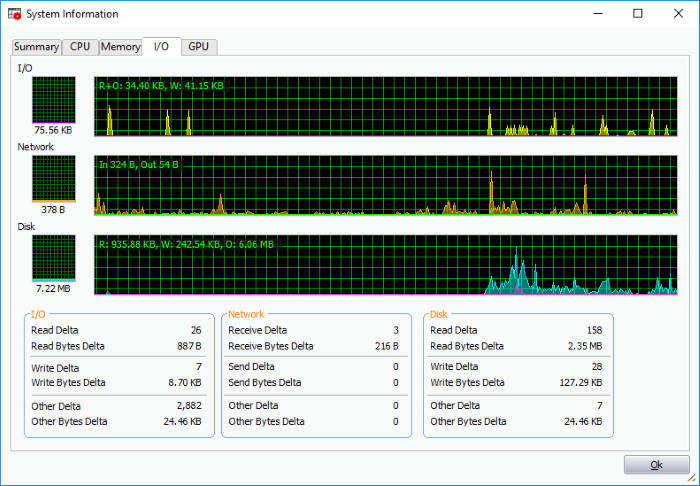
- I/O - Shows the amount of I/O operations generated by a process in KB (including files, network, and device I/Os)
- Network - Shows the amount of network input/output operations generated by a process in KB
-
Disk - Shows the amount of disk input/output operations generated by a process in KB
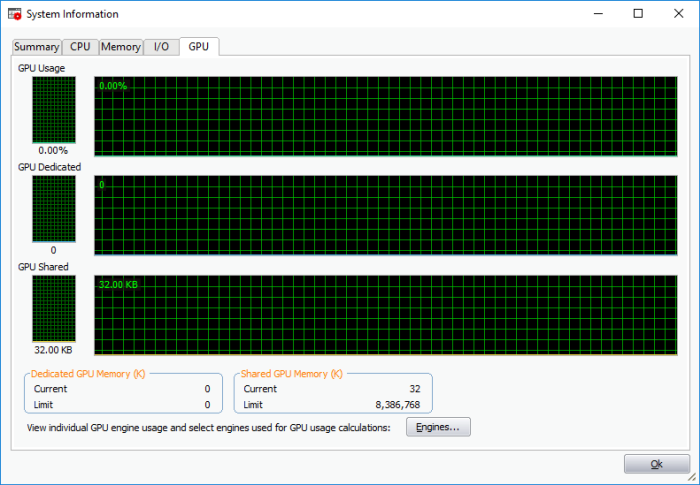
- Dedicated GPU Memory (K) - The exclusive source of video memory leaving the RAM of your system untouched.
- Shared GPU Memory (K) – This memory division is shared by RAM of your system and does not have an independent memory


