


Manage Policies
The 'Policies' interface allows admins to create new policies and apply them onto endpoints as per an organization's requirement. For example you can create a policy by including multiple monitoring modules such as 'Traffic Monitor', 'RAM Monitor', 'Disk health Monitor' and so on in order to meet the specific needs of an organization/department and apply the policy to endpoints.
If a policy is violated by an endpoint, a service desk ticket will also be created in the Service Desk module. A new policy created cannot be edited but can be deleted from the list.
To manage policies, open the 'Policies' screen, by clicking 'Policies' from the drop-down at the top left.
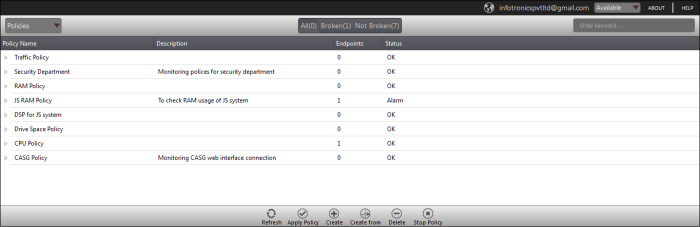
The interface displays all the created policies.
From the 'Policies' screen an admin can:
- Click the 'Create' button at the top of the interface
The 'Create Policy' dialog will be displayed:
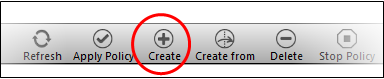
The 'Create Policy' dialog will be displayed:
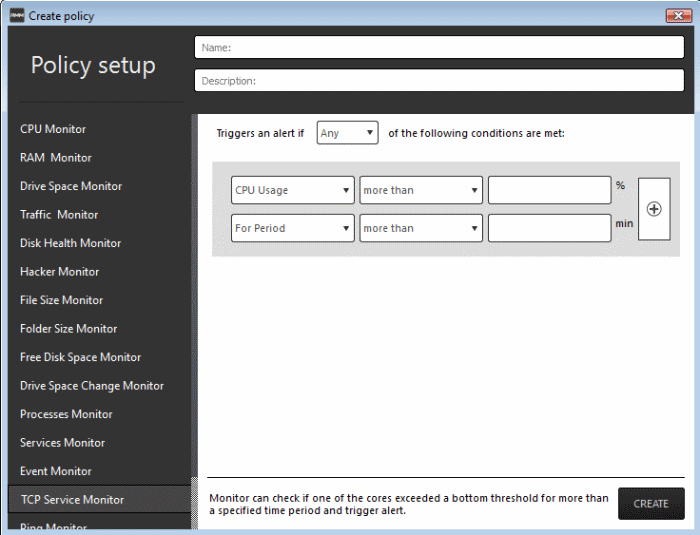
The monitoring modules are displayed on the left side of the screen and on the right side, you can configure the parameters for a selected a module. The table below provides the details of the monitoring modules.
|
Monitoring Modules |
|
|---|---|
|
Name |
Description |
|
RAM Monitor |
Checks if RAM memory usage exceeds a bottom threshold for more than a specified time and generates a service desk ticket. |
|
Traffic Monitor |
Checks if network traffic exceeds a bottom threshold for more than a specified time and generates a service desk ticket. |
|
Disk Health Monitor |
Uses 'Windows Management Instrumentation' (WMI) to check if any 'Self-Monitoring, Analysis and Reporting Technology' (SMART) disks are reporting errors to the OS. A service desk ticket is generated if any errors are reported. |
|
File Size Monitor |
Checks the disk space used by a file on target computers and generates a service desk ticket when a specific file exceeds the maximum size specified. |
|
Folder Size Monitor |
Checks the disk space used by a directory/folder on target computers and generates a service desk ticket when a specific folder exceeds the maximum specified size. |
|
Ping Monitor |
Pings a device using its hostname, fully qualified domain name or an IP Address and generates a service desk ticket if no response is recieived. |
|
TCP Service Monitor |
Checks periodically attempts to connect to a specified domain/IP:port. This allows to check for services that should be running and generates a service desk ticket when ports that should be closed become open. |
|
Hacker Monitor |
Keeps track of unsuccessful login attempts on the monitored device for the past 24 hours and generates a service desk ticket if the total number of attempts exceeds the specified number. |
|
CPU Monitor |
Checks if one of the cores exceeds a bottom threshold for more than a specified time and generates a service desk ticket.. |
|
Free Disk Space Monitor |
Checks for free disk space and generates a service desk ticket whenever the hard disk free space fall below the specified value. |
|
Process Monitor |
Checks if a set of processes are running and generates a service desk ticket. if any them is stopped. |
|
Services Monitor |
Checks periodically if the specified services are matching the required status, for example, running, stopped, not started. |
|
Web Monitor |
Checks periodically a web page identified by URL:port and passes the test as long as it responds with the entered text. |
|
Drive Space Monitor |
Keeps track of free space on OS drive partition and generates a service desk ticket if the specified value is exceeded. This monitor also checks if the data on the drive has changed by more than the set threshold and creates a service desk ticket. |
|
Drive Space Change Monitor |
Keeps track of the rate of data change on the drive and generates a service desk ticket if the data on the drive is changed more within the configured period. |
|
Event Monitor |
Checks Windows Event logs on endpoints. Service desk tickets are generated when a Windows event with the specified Event Sources, Event IDs or Even level occurs. |
- Enter a name and a short description for the policy in the respective fields
- Choose the monitoring module from the left.
The selected module's parameters pane will be displayed on the right side.
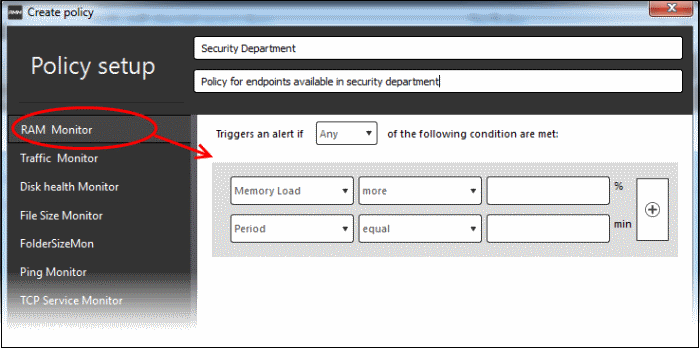
- Specify the conditions and thresholds of the rule in the right pane. Your rules are automatically saved as you go along, so you can freely select other modules on the left if you wish to add more rules to the policy.
You can add any number of
conditions for a particular rule by clicking the  button at the right. To remove a condition, click the
  button to the right.
- Add more monitoring modules if required for the policy by selecting them on the left.
A check-mark is shown next to
modules which are included in the current policy.
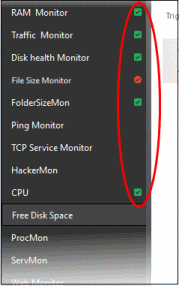
A check-mark in green background
indicates parameters are correctly configured and a check-mark in red
background indicates it is wrong configured.
- Click 'Create' to save your policy.
The policy will be added to the list in the 'Policy Manager' interface and will be available for deployment to desired endpoints at any time. Refer to the section 'Apply policy to an endpoint' for more details.
|
Tip: You can create new policies using an existing policy as a template. To create a new policy, select an existing policy and click the 'Create From' button. The 'Create policy' dialog will open with the monitoring modules pertaining to the existing policy preselected. You can edit the parameters to create a new policy. |
- Click
the
 button
beside a policy to expand the section
button
beside a policy to expand the section
The monitoring modules added for a policy are displayed below the name of the policy.
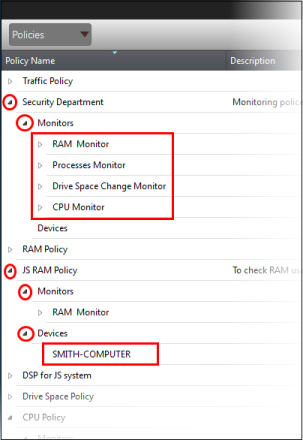
The modules and endpoints are
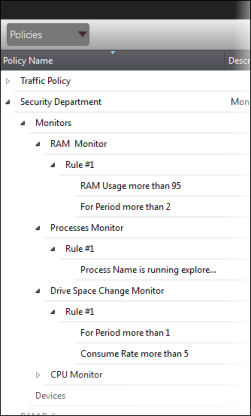
displayed below the labels 'Monitors' and 'Devices', respectively. To view the details of conditions
for the rules configured for each monitoring module, click the ![]() button beside the respective module and rule.
button beside the respective module and rule.
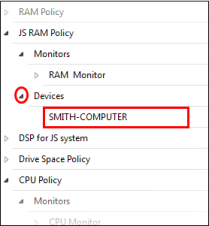
To view the details of endpoint
that is applied the policy, click the ![]() button beside 'Devices'.
button beside 'Devices'.
- Select the policy from the list that you want to remove
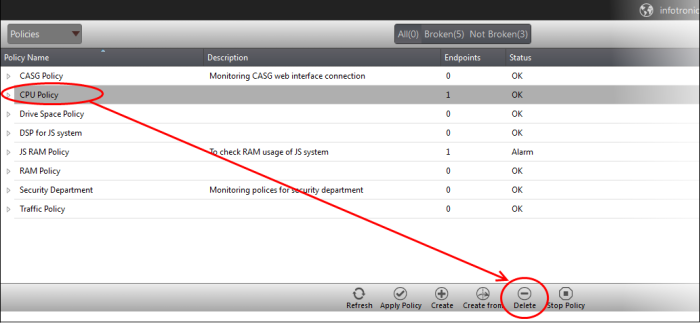
The selected policy will be deleted.
|
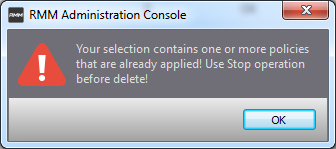
Note: Make sure the policy that you want to delete is not in force on endpoints. A warning will be displayed if you are trying to delete a policy that is in force.
Refer to the section 'To stop a policy' for more details. |
To apply a policy to an endpoint
|
Note:
|
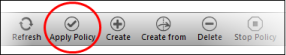
- Click the 'Apply Policy' button at the bottom of the 'Policies' interface
The 'Apply Policy' dialog will be
displayed.
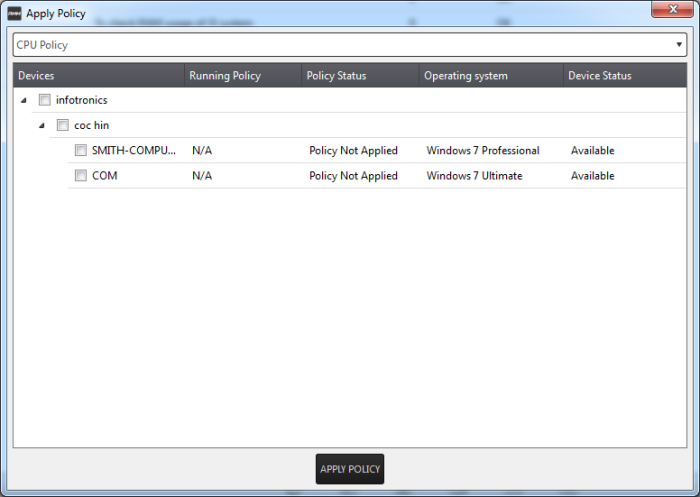
- Select
the endpoint(s) from the list
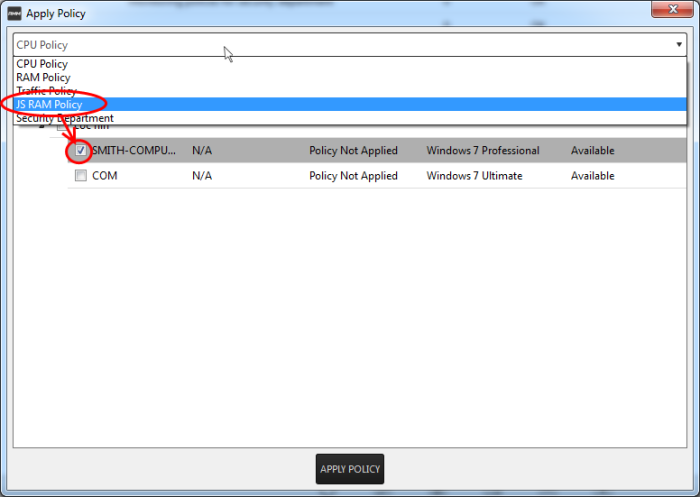
- Select the policy that you wish to apply to the selected endpoint from the drop-down at the top
- Click the 'Apply Policy' button
The policy will be deployed on the
selected endpoints and will be listed in the main 'Policies'
interface.
- Select the policy from the list
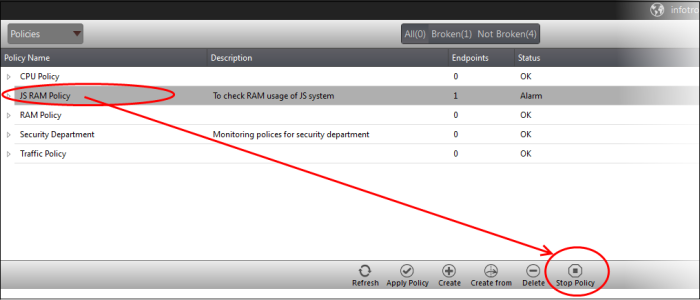
-
Click the 'Stop Policy' button.
The policy will no longer be applied for the endpoint(s). Now, if required, you can delete the policy. Refer to the section 'To delete a policy' for more details.