Manage Currently Running Processes
The 'Process Explorer' is an advanced system monitoring tool that allows admins to quickly identify, monitor and terminate any unsafe processes that are running on endpoints. The Process Explorer shows ALL running processes, even those triggered by malware in the computer and those that were invisible or very deeply hidden. The administrator can identify which of those running processes are unsafe and shut them down with a single click.
To deploy the 'Process Explorer' tool
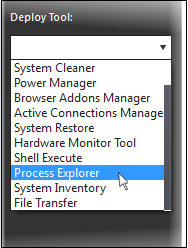
- Select 'Process Explorer' from the 'Deploy Tool' drop-down on the left

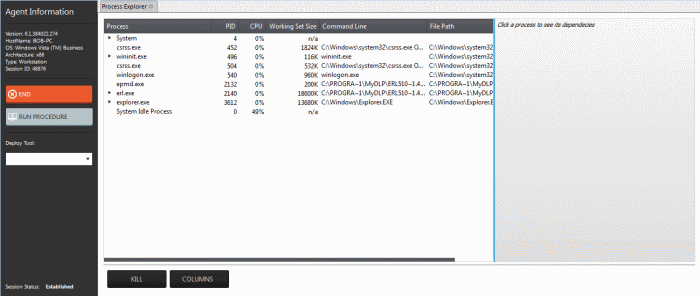
A new 'Process Explorer' tab opens
in the main configuration area. All the processes currently running
on the endpoint will be listed.

- Click
on the
 beside an item to expand it to a tree structure
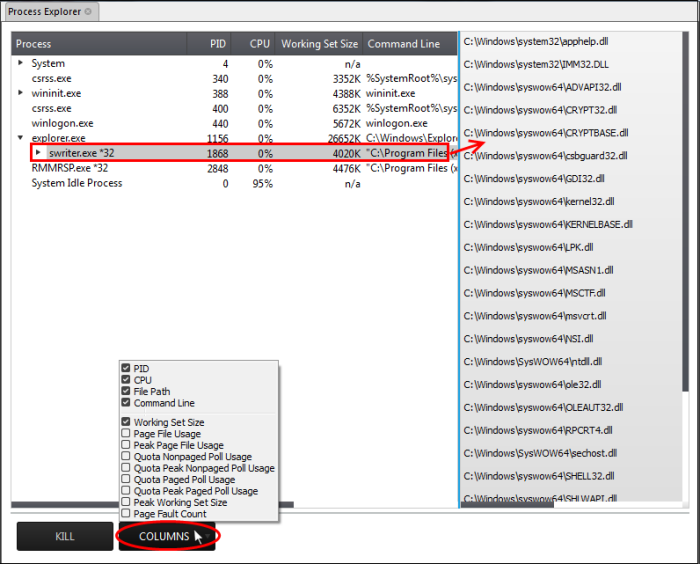
- To view the dependent processes, handles and DLLs of a process, select the process from the list. The dependent processes will be displayed on the next pane.

By default, the Process Explorer window displays the details of the process under five columns. To view more granular details of each process, an admin can add more columns to the window.
- To add more columns, click on the 'Columns' drop-down and select the details to be displayed for each process.
|
Process Explorer - Descriptions of Columns |
|
|---|---|
|
Column |
Description |
|
PID |
Displays the Process Identification number. Clicking on the column header enables sorting the entries in ascending or descending order of the PID numbers. |
|
CPU |
Displays the CPU usage of the process as a portion of overall CPU usage by the process in percentage. Clicking on the column header enables sorting the entries based on the CPU usage. |
|
File Path |
Displays the location of the executable that has initiated the process |
|
Command Line |
Displays the command line command of the executable that has initiated the process |
|
Working Set Size |
Shows the size (in KB) of the virtual memory, occupied by the page files, referenced by the process. Clicking on the column header enables sorting the entries based on working set. Background Note: The working set of a process is the collection of information referenced by the process periodically. This collections are stored as page files in the secondary memory, such as the portion of the hard disk partitions allotted as virtual memory. |
|
Page File Usage |
Indicates the memory space occupied by the process in the virtual memory, created in the hard disk drive |
|
Peak Page File Usage |
Indicates the highest memory space occupied by the process in the virtual memory since the process has been started. |
|
Quota Nonpaged Poll Usage |
Indicates the quota amount of physical memory space (in KB) allotted for non paged pool usage by the process. The non paged memory pool consists of virtual memory addresses that would reside in physical memory as long as the corresponding kernel objects of the process are allocated. |
|
Quota Peak Nonpaged Poll Usage |
Indicates the maximum quota amount assigned for non paged pool usage for the process since the process has been started. |
|
Quota Paged Poll Usage |
Indicates the quota amount of virtual memory space (in KB) allocated for the process for paging. |
|
Quota Peak Paged Poll Usage |
Indicates the maximum quota amount of virtual memory space (in KB) for the paged pool usage by the process since it has been started. |
|
Peak Working Set Size |
Indicates the maximum working set size of the process, since it has been started. |
|
Page Fault Count |
Indicates the number of interrupts occurred during the read/write access by the process to the virtual memory location, that is marked 'not present'. |
- To terminate unsafe or unwanted process, select the process and click the 'Kill' button at the bottom. Repeat the process to terminate more processes.


