Comodo Help
Find the desired product help
SOCaaP

SOCaaP

Version 2.2

English

Print Help
Dashboard Overview > Alerts,Incidents And Website Vulnerabilities
  • Introduction
    • Logging-in To The SOCaaP Console
  • Dashboard Overview
    • Summary
    • Alerts,Incidents And Website Vulnerabilities
    • Customer Health
  • SOCaaP Alerts/Escalations
    • Log-in To The Admin Console
    • The Home Screen
    • Service Summary
    • Incidents Overview
      • Incidents
      • Threat Summary
    • Log Collection Summary
    • Threat Communication Graph
    • Tickets
    • Reports
    • Notification Settings
    • Integrate Your Office 365 Account With SOCaaP
  • SOCaaP XDR
    • Log-in To The Admin Console
    • The Main Interface
    • Eveny Query
      • Configure Event Queries
    • Report Generation
    • Administration
      • Event Collection
      • Phantom Settings
      • Manage Users
    • Appendix 1 – Field Groups And Event Items Description
    • Appendix 2 –SOCaaP Supported Logs
  • SOCaaP Web Protection
    • Add Websites
    • The Main Interface
    • The Dashboard
    • Website Data And Settings
      • Website Overview
      • Security Scans
        • Website Scans
        • Website Files Security Scans
          • Malware Scan Settings
            • Automatic Configuration
            • Manual Configuration
          • Run A Scan And View Results
          • Notifications, Malware Removal And Scheduled Scans
        • Vulnerability Scans
          • CMS Vulnerability Scans
          • OWASP Top 10 Vulnerability Scans
      • Content Delivery Network
        • Activate CDN For A Website
        • CDN Settings
        • View CDN Metrics
      • Firewall
        • WAF Statistics
        • WAF Events
        • Configure WAF Policies
        • Manage Custom Firewall Rules
      • SSL Configuration
      • DNS Configuration
      • Add Trust Seal To Your Websites
      • Back Up Your Website
        • Backup Settings
        • On-Demand Backup
        • View Backup Records And File Statistics
        • Restore And Download Website Files
        • Delete Backups
    • Manage Your Profile
  • Sensor Installation
    • Requirements
    • (Option 1) Create Installation Media
    • (Option 2) Deploy Virtual Machine Environment
      • Create A New Virtual Machine
      • Configure Memory Size
      • Configure Hard Disk
      • Configure Hard Disk File Type
      • Configure Storage On Physical Hard Disk
      • Configure Size Of Virtual Hard Disk
      • Configure Network Settings
      • Select VM Startup Disk
    • Sensor Installation Steps
    • Sensor Configuration Steps
      • Login To The Web Portal
      • User Settings
      • Configure Network
      • Configure Timezone
      • Key Activation
      • (Optional) Valkyrie Key Verdict
      • (Optional) Forward Log
  • Frequently Asked Questions
  • About Xcitium Security Solutions

Alerts, Incidents and Website Vulnerabilities

Alerts

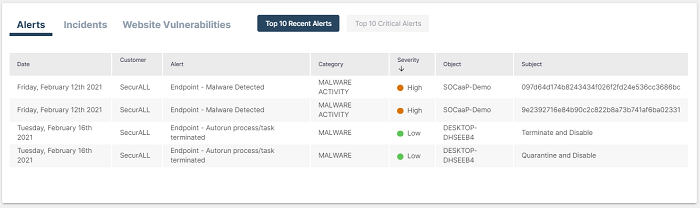
The alert shows the total rule hit count of events within the last 90 days. The ‘Alerts’ tab provides details such as the top 10 recent alerts and the top 10 critical alerts. The interface displays a list of alerts along with details such as customer network, alert messages, categories, objects, and the required action taken by the administrator

  • To filter the alerts from date, customer, alert, category, severity, and object use the arrow on the right side.

  • Click ‘Top 10 recent alerts to view the recent one and Use the tab ‘Top 10 Critical Alerts’ to view the critical alerts

The example below shows all alerts from all customer networks.


Alert List

Column Header

Description

Date

Displays the precise date and time at which the alert was detected or added.

Customer

Indicates the customer on whose network the alert was detected.

Alert

Displays the type of the alert or where should it detected

Category

Shows the category of the alert which is classified

Severity

Shows the priority level of the alerts. The options available are 'High', 'Low'

Object


Displays the object where the alert is detected

Subject

Displays the short description and action need to take for the alert based on the severity of the alert.


Incidents
  

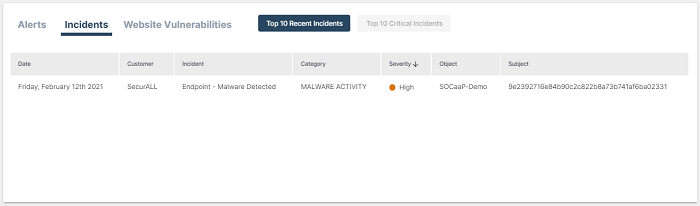
The incident shows the total true incidents that occurred within the last 90 days. The incident count is the total alert count minus false positives. The 'Incidents' tab provides details such as incident list, top 10 recent incidents and top 10 Critical Incidents. The 'Incident' interface displays a list of alerts along with details such as customer network, alert messages, categories, objects and the required action taken by the administrator

  • To filter the incidents from date, customer, incident, category, severity and object use the arrow on the right side.

  • Click ‘Top 10 Recent Incidents to view the recent one and Use the tab ‘Top 10 Critical Incidents’ to view the critical incidents.

 The example below shows all incidents from all customer networks.


Incident List

Column Header

Description

Date

Displays the precise date and time at which the incident was detected or added.

Customer

Indicates the customer on whose network the incident was detected.

Incident

Displays the Type of the incident or where should it detected

Category

Shows the category of the incident which is classified

Severity

Shows the priority level of the incidents. The options available are 'High', 'Low'

Object

Displays the object where the incident is detected

Subject

Displays the  short description and action need to take for the incident based on the severity of the incident


Website Vulnerabilities

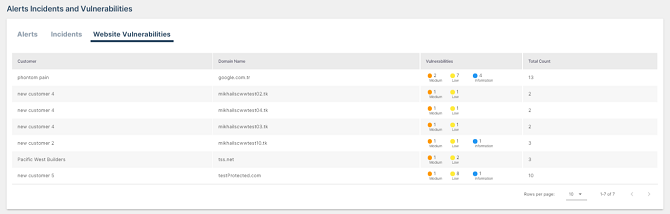
Web vulnerability assessments, you will be able to automatically determine deficiencies by crawling the website in order to discover potential vulnerabilities within a specific time period. The interface displays a list of web vulnerability of the SOCaaP customers. 


  • To filter the alerts from customer, domain name, vulnerabilities, and total count use the arrow on the right side.


 The example below shows all website vulnerability from all customer networks.


Website Vulnerabilities

Column Header

Description

Customer

Indicates the customer on whose network the vulnerabilities was detected.

Domain Name

Domain name of the enrolled customer

Vulnerabilities

Indicates the status count of vulnerabilities as low ,medium

Total Count

Shows the list of total detected vulnerabilities of a customer


Our Products
  • Free Antivirus
  • Free Internet Security
  • Website Malware Removal
  • Free Anti-Malware
  • Anti-Spam (Free Trial)
  • Windows Antivirus
  • Antivirus for Windows 7
  • Antivirus for Windows 8
  • Antivirus for Windows 10
  • Antivirus for MAC
  • Antivirus for Linux
  • Free Endpoint Security
  • Free ModSecurity
  • Free RMM
  • Free Website Malware Scanner
  • Free Device Manager for Android
  • Free Demo
  • Network Security
  • Endpoint Protection
  • Antivirus for Android
  • Comodo Antivirus
  • Wordpress Security
Cheap CDN
  • Bootstrap CDN
  • Semantic UI CDN
  • Jquery CDN
  • CDN Plans
  • CDN
  • Free CDN
Enterprise
  • Patch Management Software
  • Patch Manager
  • Service Desk
  • Website Down
  • Endpoint Protection Solutions
  • Website Security Check
  • Remote Monitoring and Management
  • Website Security
  • Device Manager
  • ITSM
  • CRM
  • MSP
  • Android Device Manager
  • MDR Services
  • Managed IT Support Services
  • Free EDR
Free SSL Certificate
Support Partners Terms and Conditions Privacy Policy

© Comodo Group, Inc. 2025. All rights reserved.