Log Collection Summary
The log summary screen is a record of logs from all SOCaaP - Alerts/Escalations sources. For example, logs collected from SOCaaP sensors placed on your network.
- Click 'Log Collection Summary' on the left and select a customer at top-right:

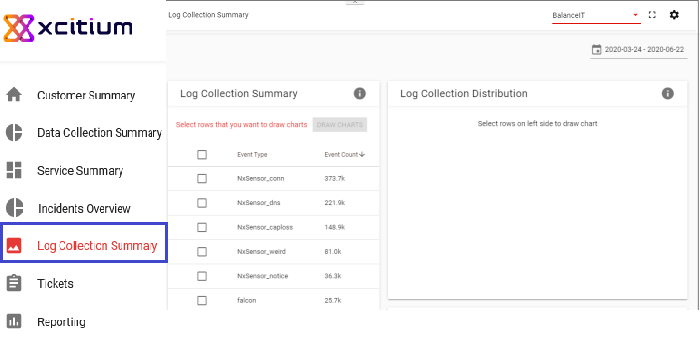
- Results are shown for the past seven days by default. Click the date above the table to view a different time frame.
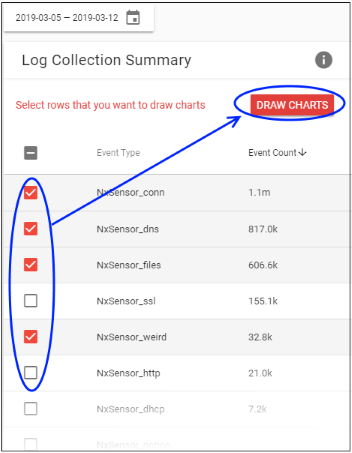
- The summary panel shows the log source and the total number of logs from that source. You can use these logs to generate graphs for the selected time period:
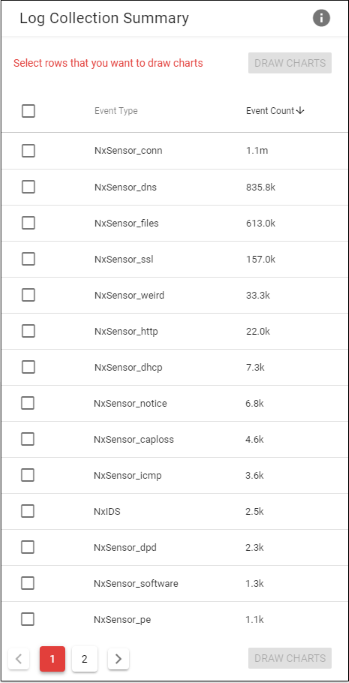
- Event Type – Name of the log source. Each source creates logs for different types of event
- Event Count – Total number of logs from the source for the selected time-period
Log Collection Distribution and Log Source Distribution
- Select one or more log sources in the 'Log Collection Summary' table on the left
- Click 'Draw Charts':
The log collection and source
distribution charts are shown on the right:
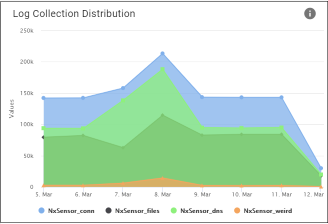
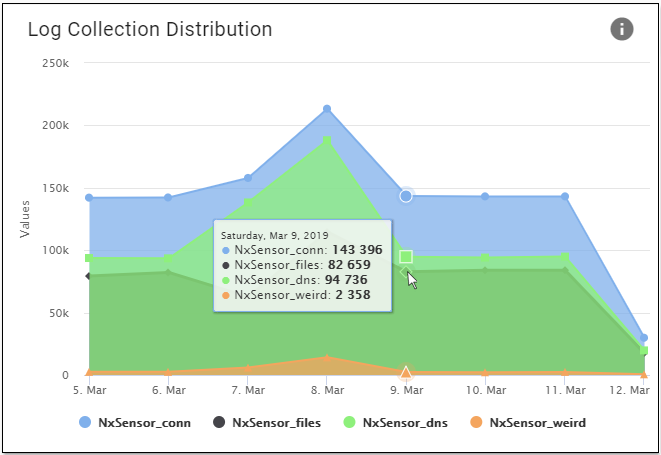
Log Collection Distribution – Line chart. Shows how many logs were generated per-day from your
sources, over your selected time period.
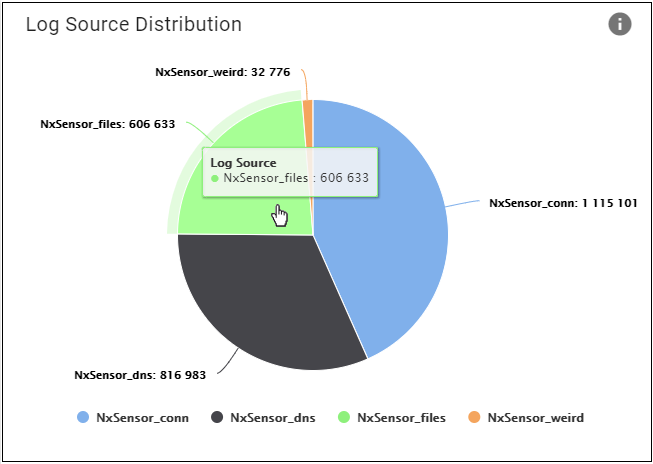
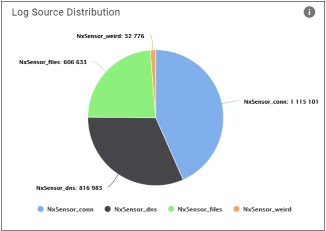
Log Source Distribution – Pie Chart. Shows the total logs collected from your selected sources, over your selected time period. Each segment represents the total logs from a particular source.
- Click a source name under the chart to remove its data from the graphic. Click the name again to re-add the data.
- Place your mouse cursor over a pie segment or date to view more details:
