


Customize the Dashboard
The default tiles in the dashboards cannot be edited or deleted. These default tiles cannot be edited or deleted. However, you can create new dashboard tiles according to your requirements. Once created, custom dashboard tiles will be available along with the default tiles. Custom tiles can be edited and removed if no longer needed.
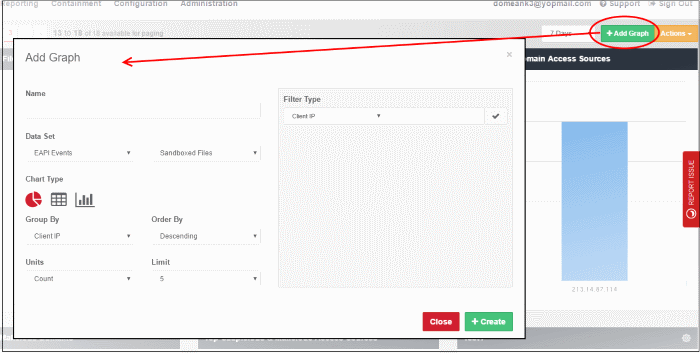
Click 'Dashboard' > 'Add Graph' to create a new tile:
|
Add Graph Dialog - Table of Column Descriptions |
|
|---|---|
|
Parameter |
Description |
|
Name |
The label of your custom tile. |
|
Data Set |
Allows you to select the data set and relevant data type to create the custom tile. The data sets available are:
The data category available in the second drop-down depends on the selected event type in the first drop-down. |
|
Chart Type |
Select the chart type. The options are pie chart, bar chart and table. |
|
Group By |
elect the parameter by which data in the tile should be organized. The available parameters depend on the selected event type. For 'EAPI Events', the options available are: Client IP, SHA1 and File Name. 'Security Events' the options are: Location, Domain, File Name, File Type, URL, File Hash (SHA1), User and Signature. For 'Web Access Events', the options are: Location, Target Address, Domain, URL, Status, Message, User, Category, Subcategory and Country. |
|
Order By |
Select whether the data in the tile should be in ascending or descending order. |
|
Units |
Indicates the unit of 'Limit' number. |
|
Limit |
Allows you to select how many 'Group By' parameters should be displayed in the chart. For example, if you have selected 'Web Access Events' and 'Blocked Traffic' as the 'Data Set', 'Category' in 'Group By', 'Descending' in 'Order By' and '5' in 'Limit', then the chart will display the five top blocked websites by category in descending order (highest number to lowest number of blocked websites). |
|
Filter Type |
Allows you to add filters to get more detailed log data. The filter types depend on the selected event type in the first drop-down. |
|
Create Button |
Click this button to add the configured tile to dashboard. |
|
Close Button |
Allows you to close the 'Add Graph' dialog. |
- Click the 'Add Graph' button
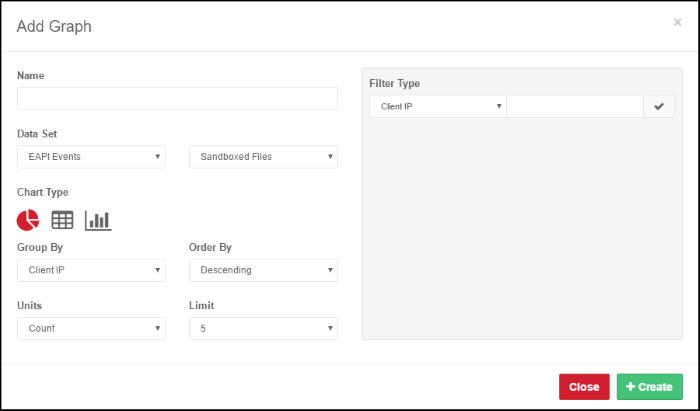
- Name – Enter an appropriate name for the custom dashboard tile
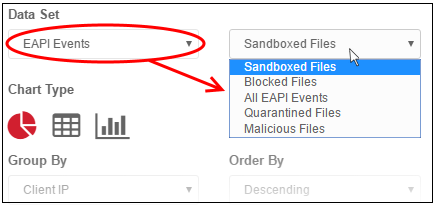
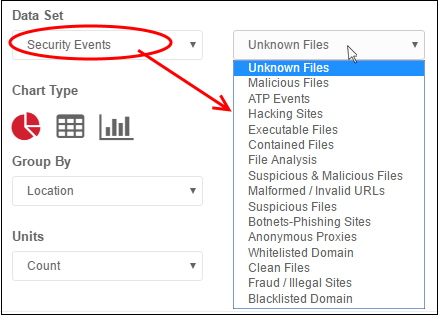
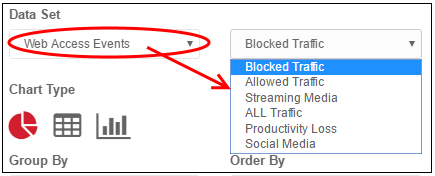
- Data Set – In the first drop-down, select event type. From the second drop-down, select the data category that you want use in the custom tile. The data category varies according to the event type.
EAPI Events
Security Events
Web Access Events
- Chart Type – Select the type of chart for the custom tile. The options available are pie chart, table and bar chart. The selected type will be highlighted in red.
- Group By – Select the parameter by which the chosen data set should be grouped.
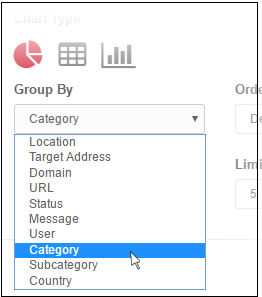
For
example to view blocked websites in all networks by category, select
'Web Access Events' and 'Blocked Traffic' in 'Data Set' and
'Category' in 'Group By'.
- Order By – Select whether the data should be in ascending or descending order depending on the quantity specified in the 'Limit drop-down. For example, if you select '5' in Limit for 'Blocked Traffic' then 'Grouped By' as 'Category' and 'Order By' as 'Descending', then the chart will display the top 5 blocked categories from highest to lowest.
- Units – Select 'Count'. This is the unit for 'Limit' value.
- Limit – Choose the number of selected parameters in Data Set and Group By that should be displayed in the chart either from the top or bottom depending on the selection in 'Order By'. You can select from '5' to '50' from the drop-down.
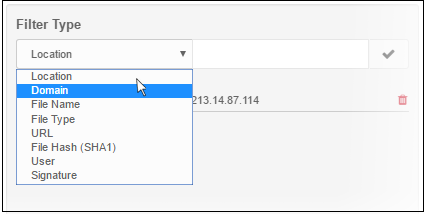
- Filter Type – You can further filter the data to be displayed in the custom tile by adding filters here. For example, select 'Location' from the drop-down and enter the IP of the network in the next field and click the check mark button. The chart will display the data pertaining to that network only. The filters available depends on the data event selected in the first drop-down under 'Data Set'.
- You can add multiple filters to display drilled down data as per your requirement.
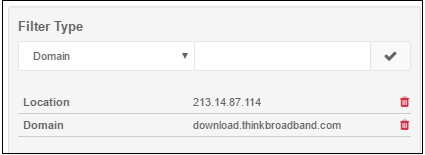
- To remove a filter, click the trash can icon beside it.
- Click the 'Create' button at the bottom of 'Add Graph' dialog after entering/selecting all the parameters.
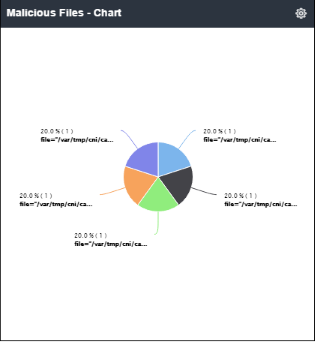
The custom tile will be created and added to the dashboard. The following example shows a custom pie chart tile added to display top 5 suspicious and malicious files detected and grouped by signature for all the networks.
Edit a custom dashboard tile
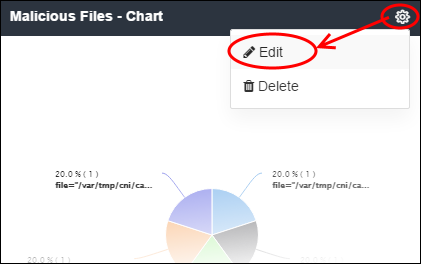
- Click the settings icon at the top right of the custom tile and click 'Edit'. Please note the setting icon will be available only for custom tiles.
The 'Edit Graph' dialog will be displayed:
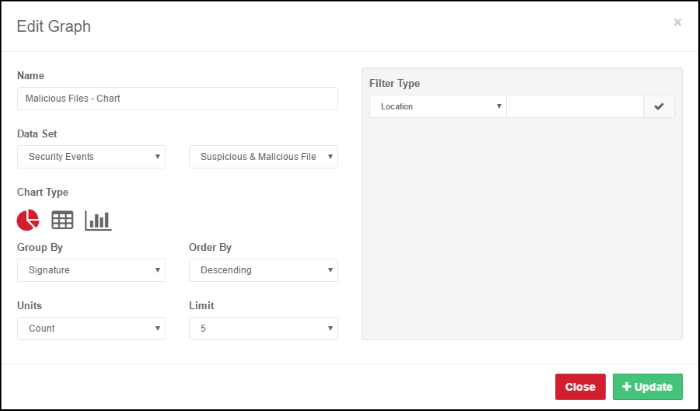
- Update the parameters as required. The process is similar to creating a new custom tile as explained above.
- Click the 'Update' button after editing the details.
The updated tile will be displayed in the dashboard.
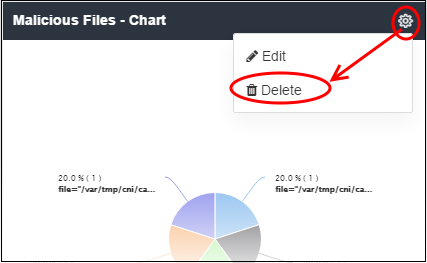
Delete a custom dashboard tile
- Click the settings icon at the top right of the custom tile and click 'Delete'. Please note the setting icon will be available only for custom tiles.
A confirmation dialog will be displayed.
- Click 'OК' to confirm removal of the tile from
the dashboard.