Custom Reports
Comodo Secure Web Gateway lets you construct reports specifically tailored to the needs of your organization.
- Click 'Reporting' > 'Custom' then '+ Create
New Report'
- In the 'Add Report' dialog, create a name and description for your report then click 'Save'
- Next, select your report on the left then click the 'Add New Section' button to begin specifying your data-set:
- A 'section' is a named area where you can group charts according to theme. You can add multiple charts to each section. For example, you can create sections to:
- Cover multiple event types in a particular event category
- Cover a specific event type (e.g. 'Blocked Traffic') with charts grouped by different parameters
- Present a specific data set with graphs showing different filters (or multiple data sets with the same filter)
- Any combination of charts that you require
- Create a name and
description for your new section and click 'Save'.
- Next, click 'Add Graph'
in your new section:
- The 'Add Graph' dialog allows you to construct your custom chart:
- The filters on the right allow you to further refine the data which is presented. For example, if you select 'Location', enter a network IP and click the check mark button then the chart will only display data pertaining to that network.
- The settings in the 'Add Graph' configuration screen are covered in more detail in Customize the Dashboard
- Repeat the process above to add more graphs and/or sections
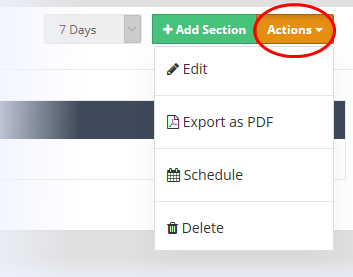
- Click 'Actions' drop down to schedule, edit, export as PDF and delete a report a particular custom report.

- Please note that you can schedule any type of report from the scheduled reports tab.


