The RMM Administrative Console
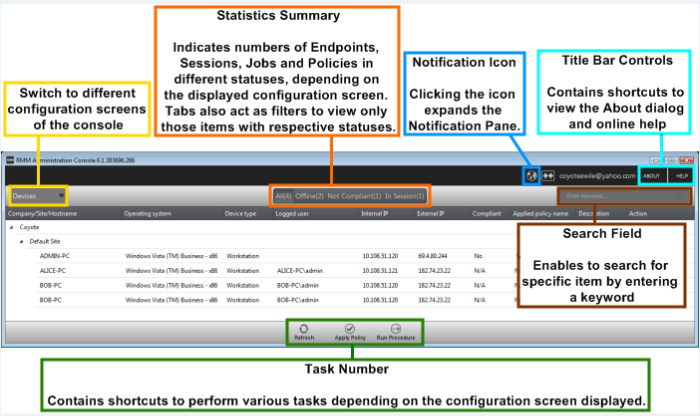
The Administrative Console is the nerve center of Remote Monitoring and Management (CRMM), allowing administrators to view details of monitored endpoints, create policies, automatically run procedures and more, on the endpoints.

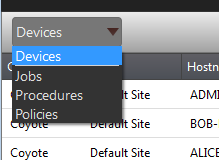
The console consists of the following main areas that can be selected from the drop-down menu near the top left - 'Devices', 'Jobs', 'Procedures' and 'Policies'.
Main Functional Areas

- Devices – View the list of monitored devices and manage them. You can run procedures and apply configuration policies on endpoints.
- Jobs – View the jobs that are completed, started and in progress. You can also stop the job from this interface.
- Procedures – Create procedures from a set of predefined actions such as 'System Restore', 'File Transfer', 'Shell Execute' and run them on endpoints
- Policies – Create policies and deploy them onto endpoints so as to generate service desk tickets if policies are violated.
Notification Icon
The notification icon at the top right of the interface blinks to alert the admin when an endpoint in session is disconnected or reconnected.
- Click on the icon to view the messages
The messages that are in bold indicate that they are not read.
- Click the 'Mark as read' link below the message window after viewing the messages
- Click the 'Clear' link to remove the messages from the window.
- Click on the notification icon again to close the message window.
About
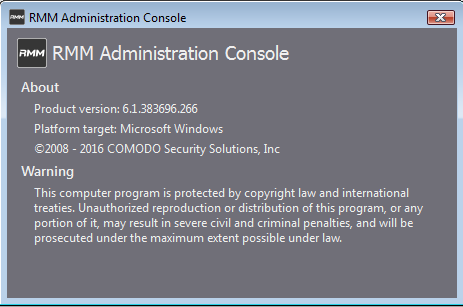
Opens the 'About' dialog of RMM admin console that contains the version number, copyright information, license information and option to purchase and change the license key.

Help
Opens
the online help guide main page. The RMM admin help guide contains
detailed explanations of the functionality and usage of the
application.


