View and Edit Monitors
- You can view the details of predefined and custom monitors, but you can only edit custom monitors.
- You can also view profiles in which a monitor is active, and events generated by the monitor.
View details of a monitor
- Click 'Configuration Templates' > 'Monitors'
- Click the name of a monitor to open its configuration interface
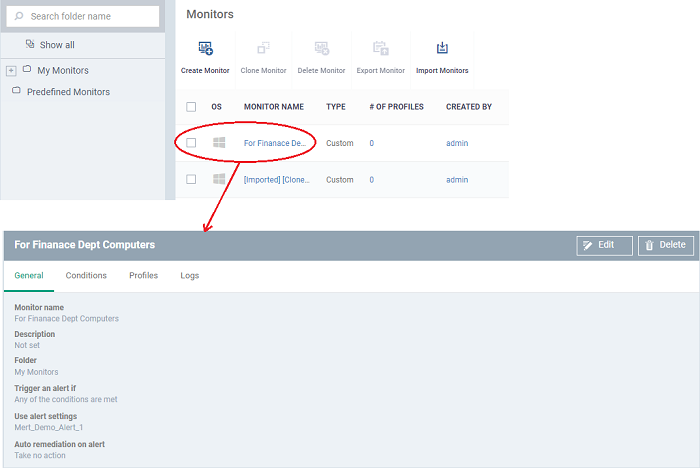
The configuration interface allows you to:
- Click 'Configuration Templates' > 'Monitors'
- Click on the name of a monitor. The monitor configuration interface will open at the 'General' tab.
- Click the 'Edit' button to modify the details.
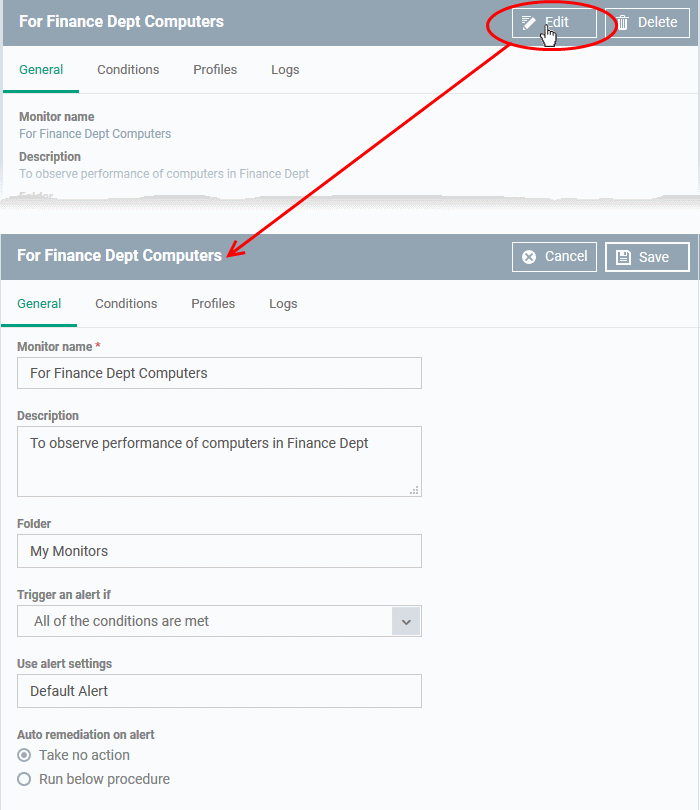
- General - Modify the name, description, location, alert settings and more
- Conditions - Modify the items which are tracked by the monitor
Editing the conditions is similar to adding conditions to a monitor. See Monitors for Windows Devices / Monitors for Mac OS Devices for more details.
- Click 'Save' for your changes to take effect.
- The changes are immediately implemented in all profiles which use the monitor.
View all profiles which use a particular monitor
- Click 'Configuration Templates' > 'Monitors'
- Click the name of a monitor to open its configuration interface.
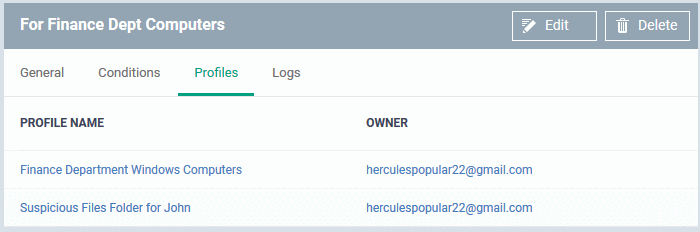
- Click the 'Profiles' tab.
|
Monitors - Column Descriptions |
|
|---|---|
|
Column Heading |
Description |
|
Profile Name |
The profile in which the monitor is active.
|
|
Owner |
The administrator who created the profile.
|
- Click 'Configuration Templates' > 'Monitors'
- Click the name of a monitor to open its configuration interface.
- Click
the 'Logs' tab.
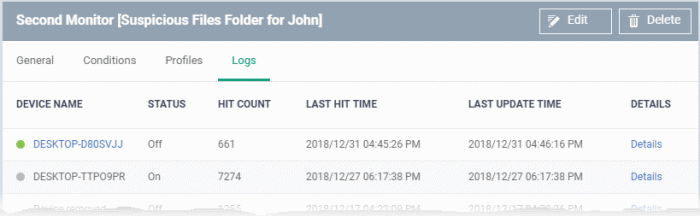
The 'Logs' tab shows all instances where the conditions of the monitor were breached:
|
Monitoring Logs - Table of Column Descriptions |
|
|---|---|
|
Column Heading |
Description |
|
Device Name |
The Windows or Mac OS device on which the violation occurred.
|
|
Status |
Whether or not the monitor is currently active on the device. |
|
Hit Count |
Number of times the monitored conditions were breached in the last 24 hours. |
|
Last Hit Time |
Date and time the monitoring rule was last broken. |
|
Last Update Time |
Date and time when the information was last refreshed. |
|
Details |
|
- Click the 'Details' link to view the details of the violations of the monitoring conditions:
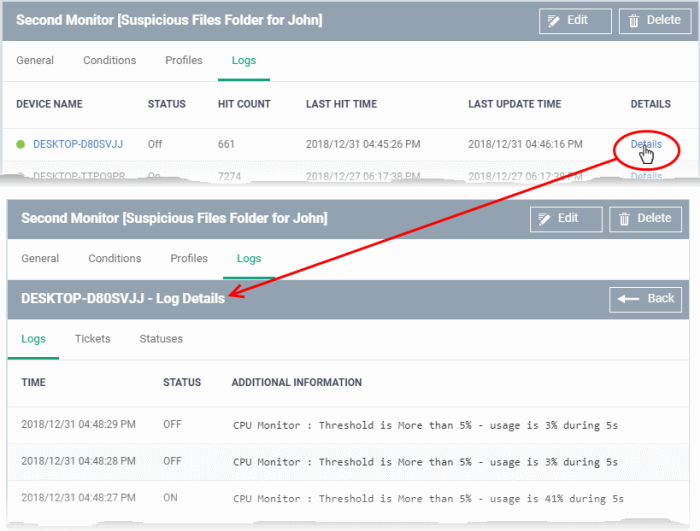
Details are shown under three tabs:
Logs - The date and time when the event occurred. Also shows the details of the monitoring rule that detected the event.
|
Monitoring Log Details - 'Logs' tab - Table of Column Descriptions |
|
|---|---|
|
Column Heading |
Description |
|
Time |
Date and time of the event. |
|
Status |
The current state of the monitor on the device:
|
|
Additional Information |
Details on the condition monitored and the breach. |
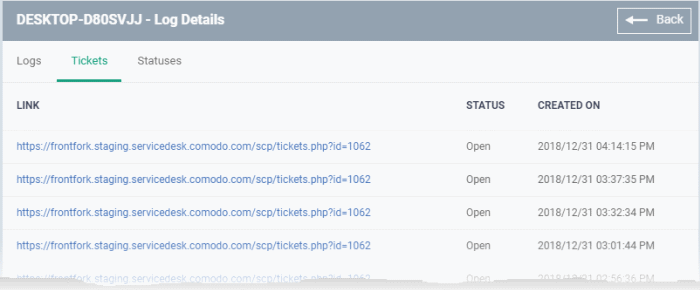
Tickets - Shows any service desk tickets which were automatically generated by the alert.
|
Monitoring Log Details - 'Tickets' tab - Table of Column Descriptions |
|
|---|---|
|
Column Heading |
Description |
|
Link |
A link to the support ticket created for the breach event.
|
|
Status |
Indicates whether the ticket is open or closed. |
|
Created On |
The date and time at which the ticket was created. |
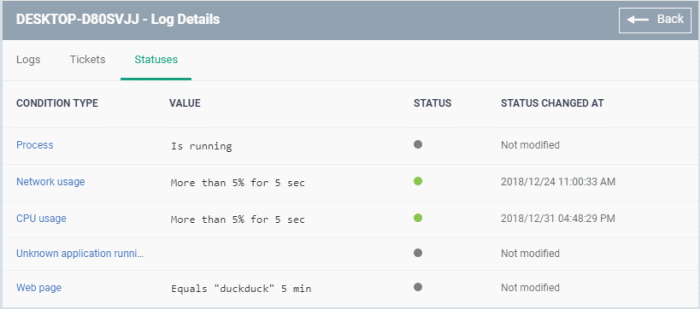
Statuses - Shows the current status of each condition in the monitor:
|
Monitoring Log Details - 'Statuses' tab - Table of Column Descriptions |
|
|---|---|
|
Column Heading |
Description |
|
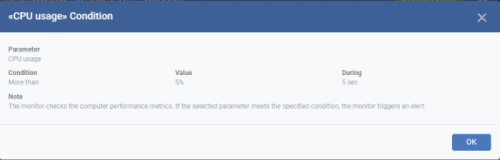
Condition Type |
The category of monitor. Click the type to view its exact conditions and thresholds. An example is shown below:
|
|
Value |
The thresholds set for the parameter. |
|
Status |
The current state of the monitored parameter on the device.
|
|
Status Changed at |
The date and time of the last change in state of the monitored parameter. |