


View Device Logs
The 'Logs' tab shows all events that occurred on a specific device. This contrasts to ‘Dashboard’ > ‘Audit Logs’, which shows events on all devices.
View device logs
- Click 'Devices' > 'Device List'
- Click the 'Device Management' tab in the top-menu
- Select a company or a group to view just their devices
Or
- Select 'Show all' to view every device enrolled to EM
- Click the name of a Windows device
- Click the 'Logs' tab
There are
eight types of logs, each shown on a different tab. Each row on these
tabs is a specific event.
- The first column shows the template that caused the log to be generated. This is a named monitor, procedure or discovery task.
- You can manage these templates in 'Configuration Templates' > 'Alerts' > 'Procedures' / 'Monitors'
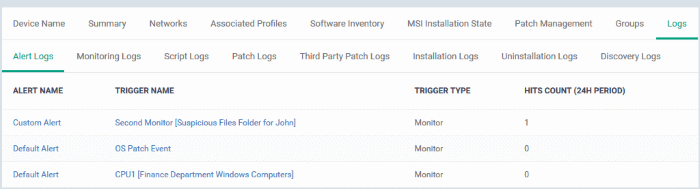
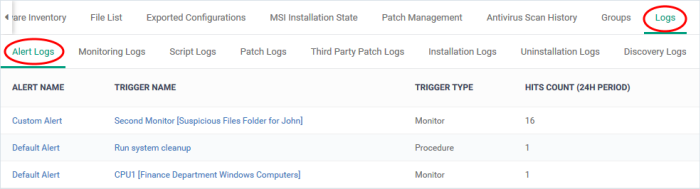
- The 'Alert Logs' tab has a slightly different layout. The template is shown in the ‘Trigger Name’ column
- The last column, 'Details', shows the contents of the log. Click this to view all steps that occurred in the event.
- Again, this is slightly different in the ‘Alert Logs’ tab. ‘Details’ is replaced with ‘Hit Count’.
- Each row represents a different event. For example, event logs are created when:
- A procedure fails
- A condition is breached in a monitor
- An alert is generated on the device
- A script or patch procedure is executed
- An app from the 'Windows Application Store' is installed
- An OS update is installed or uninstalled
- A network discovery scan is run
A record of
all events where an alert was generated on the endpoint. For example,
logs are generated after a failed procedure deployment or a breach of
monitoring conditions.
View alert logs
- Click 'Devices' > 'Device List'
- Click the 'Device Management' tab in the top menu
- Select a company or a group to view just their devices
Or
- Select 'Show all' to view every device enrolled to EM
- Click the name of the Windows device then select the 'Logs' tab
- Select 'Alert Logs'
|
Alert Logs - Table of Column Descriptions |
|
|---|---|
|
Column Heading |
Description |
|
Alert Name |
The alert template used in the event.
|
|
Trigger Name |
The monitor or procedure that generated the alert.
|
|
Trigger Type |
Can be 'Monitor' or 'Procedure' as explained above. |
|
Hits Count (24 H Period) |
The number of time this condition was triggered in the past 24 hours. |
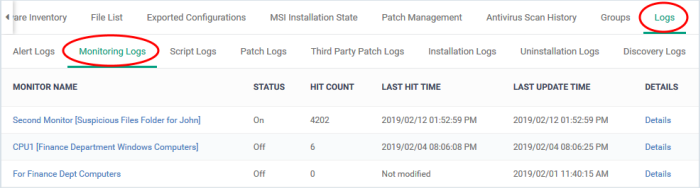
- The 'Monitoring Logs' tab
- Monitors are procedures which keep track of specific items on an endpoint. For example, you may set a monitor to track disk usage does not exceed a certain percentage.
- Monitors can be added to the 'Monitoring' section of a configuration profile
- Logs are shown for the past 24 hours.
- See Manage Monitor for help to create monitors
- See Monitor Settings for help to add monitors profile
View monitoring logs
- Click 'Devices' > 'Device List'
- Click the 'Device Management' tab
- Select a company or a group to view devices in that group
Or
- Select 'All Devices' to view every device enrolled to EM
- Click the name of the Windows device then select the 'Logs' tab
- Click 'Monitoring Logs'
|
Monitoring Logs - Table of Column Descriptions |
|
|---|---|
|
Column Heading |
Description |
|
Monitor Name |
The monitoring condition that was triggered to create the log.
|
|
Status |
The status of the device at the time of last monitoring. |
|
Hit Count |
The number of times the monitoring condition was breached during the last 24 hours. |
|
Last Hit Time |
Date and time the monitoring rule was last broken. |
|
Last Update Time |
Date and time when the information was last refreshed. |
|
Details |
|
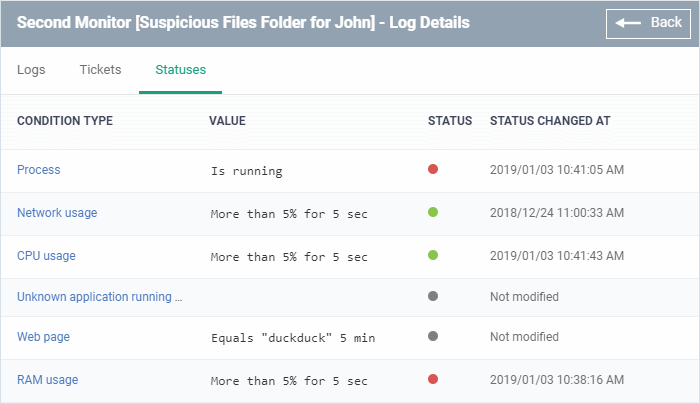
View Details of Monitoring Logs
- Click the 'Details' link to view event information and the conditions of a monitor:
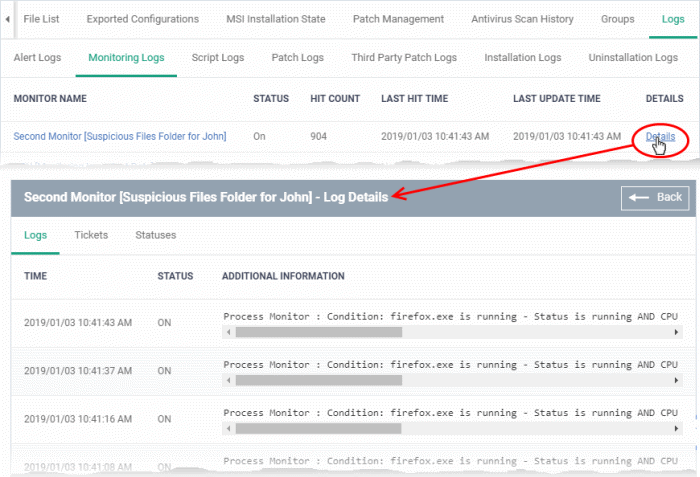
Details are shown under three tabs:
Logs - The date and time when the event occurred. Also shows details about the monitoring rule that detected the event.
|
Monitoring Log Details - 'Logs' tab - Table of Column Descriptions |
|
|---|---|
|
Column Heading |
Description |
|
Time |
Date and time of the event. |
|
Status |
The current status of the monitored condition on the device. |
|
Additional Information |
Details on the condition monitored and the breach |
Tickets - Shows any service desk tickets created by the events.

|
Monitoring Log Details - 'Tickets' tab - Table of Column Descriptions |
|
|---|---|
|
Column Heading |
Description |
|
Link |
A link to the support ticket created for the breach event.
|
|
Status |
Indicates whether the ticket is open or closed. |
|
Created On |
The date and time at which the ticket was created. |
Statuses - Shows the current status of all conditions monitored on the device.
|
Monitoring Log Details - 'Statuses' tab - Table of Column Descriptions |
|
|---|---|
|
Column Heading |
Description |
| Condition Type |
The observed parameter of the monitor. Click the condition to view the details of the monitored parameter and configured thresholds. An example is shown below: 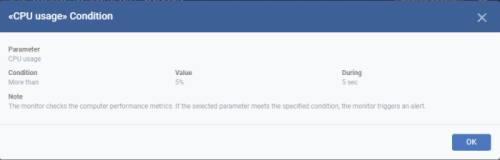 |
| Value |
The thresholds set for the parameter. |
|
Status |
Current state of the monitored parameter.
|
| Status Changed at | The date and time of the most recent change to the monitor status. |
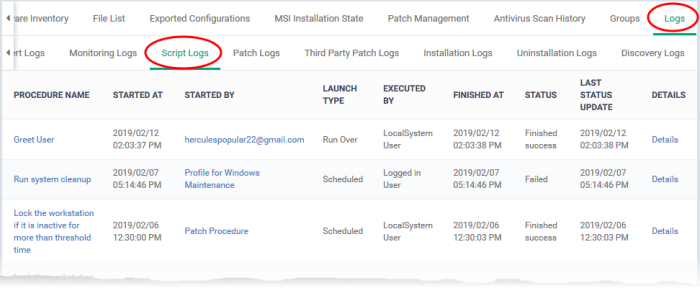
- The 'Script Logs' tab shows script procedures that were manually run on Windows devices as well as those run automatically via a profile.
- For more details on creating and running script procedures, see Manage Procedures.
To view script procedures logs
- Click 'Devices' > 'Device List'
- Click the 'Device Management' tab in the top-menu
- Select a company or a group to view just their devices
Or
- Select 'Show all' to view every device enrolled to EM
- Click the name of the Windows device then select the 'Logs' tab
- Click 'Script Logs'
|
Script Procedure Logs - Table of Column Descriptions |
|
|---|---|
|
Column Heading |
Description |
|
Procedure Name |
The label of the script procedure that was run on the device.
|
|
Started At |
The date and time when the procedure commenced. |
|
Started By |
Who or what launched the procedure.
|
|
Launch Type |
Whether the procedure was scheduled or run manually. |
|
Executed By |
The user account type used by EM to execute the procedure. |
|
Finished At |
The date and time when the procedure was completed. |
| KB | The Microsoft knowledgebase articles for the patches successfully deployed by the procedure.
|
| Failed Patch KB | The Microsoft knowledgebase articles for the patches whose deployment failed. Click the number to view the article. |
|
Status |
Whether the script successfully executed or not. You can configure an alert if a procedure deployment fails. See 'Manage Procedures' for more details. |
|
Last Status Update |
Indicates the date and time when the information was last updated. |
| Targeted Patch Count | The number of patches included for deployment in the procedure. |
|
Details |
|
View Script Procedure Log details
- Click the 'Details' link to view details about a procedure's execution:
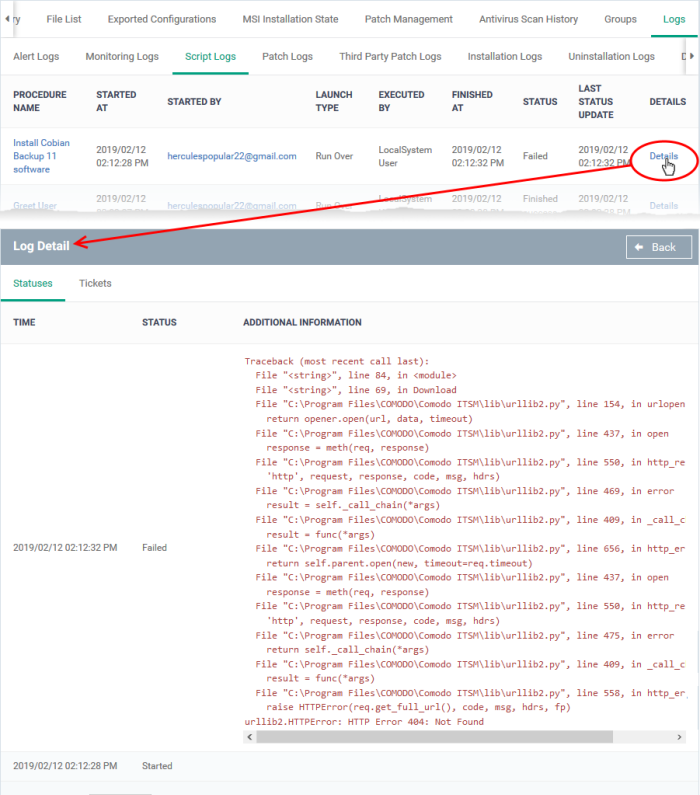
The details are displayed under two tabs:
Statuses - The date and time at which successive stages in the procedure were run, their success status and results.
|
Script Procedure Log Details - 'Statuses' tab - Table of Column Descriptions |
|
|---|---|
|
Column Heading |
Description |
|
Time |
The date and time of the procedure execution. |
|
Status |
Whether the execution was successful or not. |
|
Additional Information |
Provides details on the execution:
|
Tickets - Displays tickets raised for any failed procedures.

|
Script Procedure Log Details - 'Tickets' tab - Table of Column Descriptions |
|
|---|---|
|
Column Heading |
Description |
|
Link |
Links to the support ticket created because of the failed procedure.
|
|
Status |
Whether the ticket is open or closed. |
|
Created On |
The date and time at which the ticket was created. |
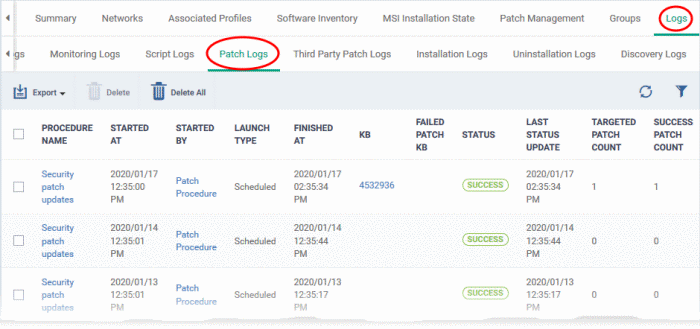
- The 'Patch Logs' tab shows OS patch procedures that were manually run on Windows devices as well as those run automatically via a profile.
- For more details on creating and running patch procedures, see Manage Procedures.
To view patch procedures logs
- Click 'Devices' > 'Device List'
- Click the 'Device Management' tab in the top-menu
- Select a company or a group to view just their devices
Or
- Select 'Show all' to view every device enrolled to EM
- Click the name of the Windows device then select the 'Logs' tab
- Click 'Patch Logs'.
|
Patch Procedure Logs - Table of Column Descriptions |
|
|---|---|
|
Column Heading |
Description |
|
Procedure Name |
The label of the patch procedure that was run on the device.
|
|
Started At |
The date and time when the procedure commenced. |
|
Started By |
Who or what launched the procedure.
|
|
Launch Type |
Whether the procedure was scheduled or run manually. |
|
Finished At |
The date and time when the procedure was completed. |
| KB | Microsoft knowledgebase articles for successfully deployed patches.
|
| Failed Patch KB | Microsoft knowledgebase articles for patches whose deployment failed.
|
|
Status |
Whether the OS patch procedure was successfully executed or not. You can configure an alert if a procedure deployment fails. See 'Manage Procedures' for more details. |
|
Last Status Update |
The date and time when the information was last updated. |
| Targeted Patch Count | Total number of patches included in the procedure. |
| Success Patch Count | Number of patches that were successfully installed. |
|
Details |
|
View OS Patch Procedure Log details
- Click the 'Details' link to view details about a procedure's execution:
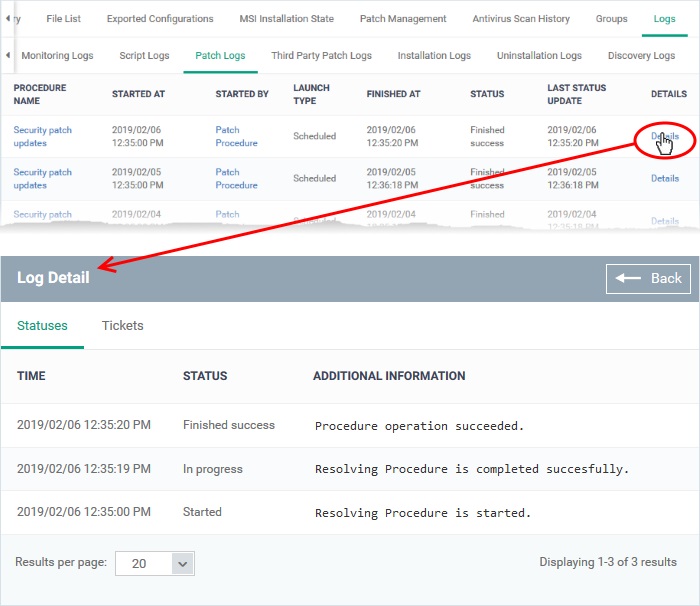
The details are displayed under two tabs:
Statuses - The date and time at which successive stages in the procedure were run, their success status and results.
|
OS Patch Procedure Log Details - 'Statuses' tab - Table of Column Descriptions |
|
|---|---|
|
Column Heading |
Description |
|
Time |
Date and time of the procedure execution. |
|
Status |
Whether the execution was successful or not. |
|
Additional Information |
Provides details on the execution:
|
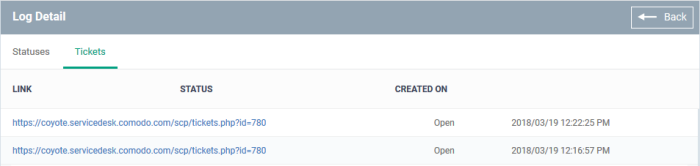
Tickets - Displays tickets raised for any failed procedures.
|
Monitoring Log Details - 'Tickets' tab - Table of Column Descriptions |
|
|---|---|
|
Column Heading |
Description |
|
Link |
Links to the support
ticket created because of the failed procedure.
|
|
Status |
Whether the ticket is open or closed. |
|
Created On |
The date and time at which the ticket was created. |
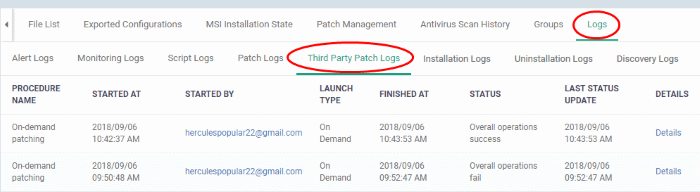
View Third Party Patch Procedure Logs
- The third-party patch tab shows logs of patch deployments run on third party applications.
- This includes procedures that were run manually and those run automatically via a profile.
- If you need help to create patch procedures, see Manage Procedures.
View third party procedures logs
- Click 'Devices' > 'Device List'
- Click the 'Device Management' tab in the top-menu
- Select a company or a group to view just their devices
Or
- Select 'Show all' to view every device enrolled to EM
- Click the name of the Windows device then select the 'Logs' tab
- Click 'Third Party Patch Logs'
|
Third Party Patch Logs - Table of Column Descriptions |
|
|---|---|
|
Column Heading |
Description |
|
Procedure Name |
The label of the procedure that was run on the device.
|
|
Started At |
The date and time when the procedure commenced. |
|
Started By |
Who or what launched the procedure.
|
|
Launch Type |
Indicates whether the procedure was scheduled or run manually. |
|
Finished At |
The date and time when the procedure was completed. |
|
Status |
Whether the third party patch procedure was successfully executed or not.
|
|
Last Status Update |
Date and time when the information was last updated. |
|
Details |
|
View Third Party Patch Procedure Log details
- Click the 'Details' link to view details about a procedure's execution:
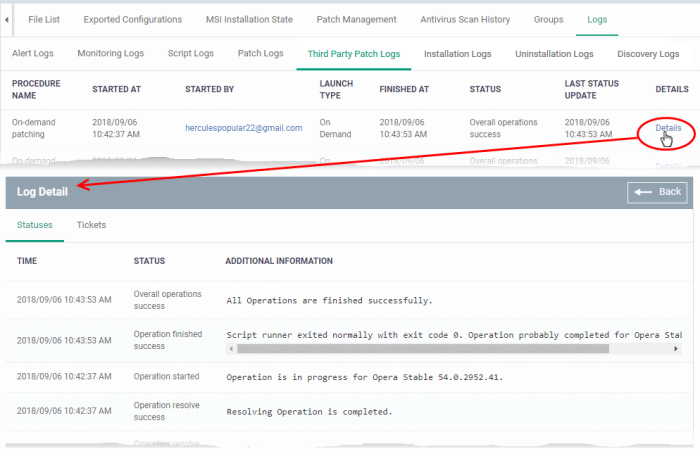
The details are displayed under two tabs:
Statuses - The date and time at which successive stages in the procedure were run, their success status and results.
|
Third Party Patch Log Details - 'Statuses' tab - Table of Column Descriptions |
|
|---|---|
|
Column Heading |
Description |
|
Time |
Date and time of the procedure execution. |
|
Status |
Whether the execution was successful or not. |
|
Additional Information |
Provides details on the execution:
|
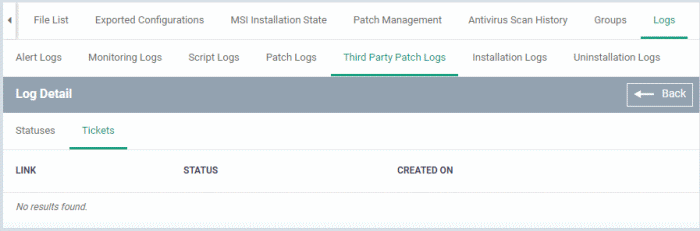
Tickets - Displays tickets raised for any failed procedures.
|
Third Party Patch Log Details - 'Tickets' tab - Table of Column Descriptions |
|
|---|---|
|
Column Heading |
Description |
|
Link |
A link to the support ticket created for the breach event.
|
|
Status |
Whether the ticket is open or closed. |
|
Created On |
The date and time at which the ticket was created. |
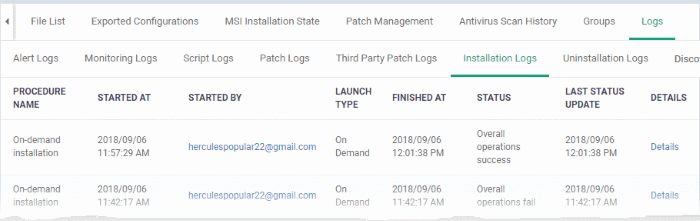
- 'Installation Logs' tab - shows installations of third party applications from the Windows application Store ('Application Store' > 'Windows Application Store').
- See Install Windows Apps on Devices for more details on remote installation.
To view installation logs
- Click 'Devices' > 'Device List'
- Click the 'Device Management' tab in the top-menu
- Select a company or a group to view just their devices
Or
- Select 'Show all' to view every device enrolled to EM
- Click the name of the Windows device then select the 'Logs' tab
- Click 'Installation Logs'
|
Installation Logs - Table of Column Descriptions |
|
|---|---|
|
Column Heading |
Description |
|
Procedure Name |
The possible value is 'On-demand installation'. Install apps from 'Application Store' > 'Windows Application Store'. |
|
Started At |
The date and time when the installation commenced. |
|
Started By |
The administrator who started the remote installation.
|
|
Launch Type |
Indicates whether the procedure was scheduled or run manually. The possible value is 'On Demand'. |
|
Finished At |
The date and time when the installation was completed. |
|
Status |
Whether the remote installation was successful, in progress, or failed. |
|
Last Status Update |
The date and time when the information was last refreshed. |
|
Details |
|
View Details of Installation Logs
- Click the 'Details' link to view details about a procedure's execution:
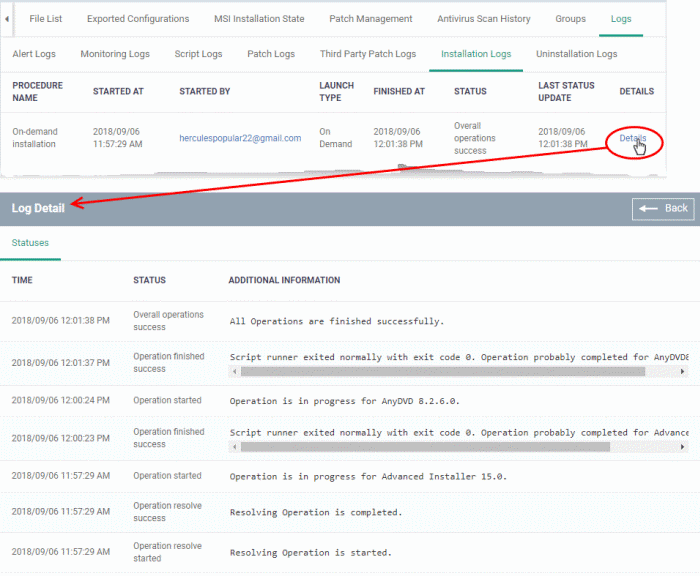
The 'Log Details' pane shows the date and time at which successive stages in the installation were run, their success status and results.
|
Installation Log Details - 'Statuses' tab - Table of Column Descriptions |
|
|---|---|
|
Column Heading |
Description |
|
Time |
Date and time each stage in the installation was run. |
|
Status |
Whether the execution was successful or not. |
|
Additional Information |
Show current installation progress.
|
- The uninstallation tab contains logs about the removal of third party applications from devices.
There are two ways in which you can remotely uninstall applications:
-
'Device Details' interface – You can uninstall selected application(s) from an individual device.
- Click 'Devices' > 'Device List' > 'Device Management'
- Click the name of a Windows device and select the 'Software Inventory' tab
- Select the applications and click 'Uninstall Selected Application' on the top
- See View and Manage Applications Installed on a Device for more details
-
'Global Software Inventory' interface - You can uninstall selected application(s) from all managed devices on which the are currently installed.
- Click 'Applications' > 'Global Software Inventory'
- Select the application to be uninstalled
- Click 'Uninstall' on the top
- See View and Manage Applications Installed on Windows Devices for more details
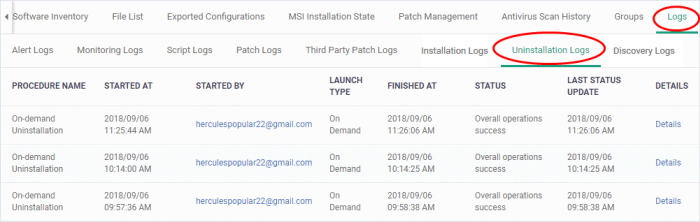
View uninstallation logs
- Click 'Devices' > 'Device List'
- Click the 'Device Management' tab
- Select a company or a group to view just their devices
Or
- Select 'Show all' to view every device enrolled to EM
- Click the name of the Windows device then select the 'Logs' tab
- Click 'Uninstallation Logs'
|
Uninstallation Logs - Table of Column Descriptions |
|
|---|---|
|
Column Heading |
Description |
|
Procedure Name |
The possible value is 'On-demand Uninstallation'. You can uninstall apps from devices by two ways explained above. |
|
Started At |
The date and time when the uninstallation commenced. |
|
Started By |
The administrator who started the remote uninstallation.
|
|
Launch Type |
Indicates whether the procedure was scheduled or run manually. The possible value is 'On Demand'. |
|
Finished At |
The date and time when the uninstallation was completed. |
|
Status |
Whether the remote uninstallation was successful, in progress, or failed. |
|
Last Status Update |
The date and time when the information was last refreshed. |
|
Details |
|
View Details of Uninstallation Logs
- Click the 'Details' link to view details about a remote uninstallation execution:
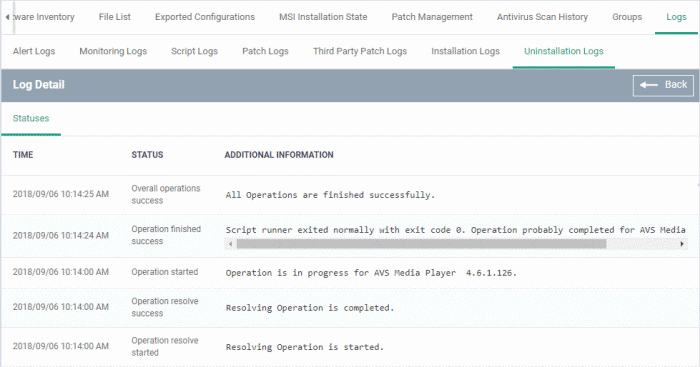
The 'Log Details' pane shows the date and time at which successive stages in the uninstallation were run, their success status and results.
|
Installation Log Details - 'Statuses' tab - Table of Column Descriptions |
|
|---|---|
|
Column Heading |
Description |
|
Time |
Date and time each stage in the uninstallation was run. |
|
Status |
Whether the execution was successful or not. |
|
Additional Information |
Show current installation progress.
|
View Discovery Logs
- A managed endpoint can be used as a probe device which runs discovery scans on a network.
- If a device has been used as a probe, then the discovery logs tab shows any scans run from it.
- See Create, Manage and Run Network Discovery Tasks if you want to learn more about discovery scans and probe devices.
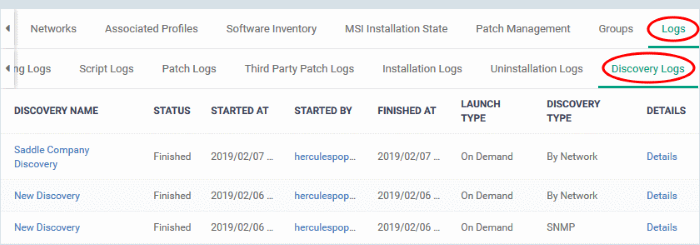
View discovery logs
- Click 'Devices' > 'Device List'
- Click the 'Device Management' tab in the top-menu
- Select a company or a group to view just their devices
Or
- Select 'Show all' to view every device enrolled to EM
- Click the name of the Windows device then select the 'Logs' tab
- Click 'Discovery Logs'
|
Installation Logs - Table of Column Descriptions |
|
|---|---|
|
Column Heading |
Description |
|
Discovery Name |
The label of the discovery scan task.
|
|
Status |
Whether the scan is progress, queued or finished. |
|
Started At |
Date and time the scan commenced on the network. |
|
Started By |
The email address of the admin who launched the scan.
|
|
Finished At |
The date and time the scan ended. |
|
Launch Type |
How the scan was started. For example, 'On Demand' means it was manually started by an admin. |
|
Type of Discovery |
Can be SNMP scan or network (IP) scan. |
|
Details |
|
View Details of a Discovery Scan
- Click 'Details' in the row of a scan to view additional information:
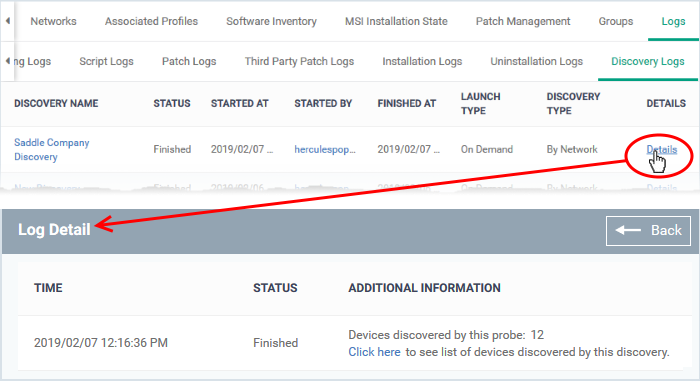
- 'Click here' link - View devices found by the scan.
- See Discovered Devices for more details.