


The Dashboard
The dashboard provides a at-a-glance summary of the current running status, health and usage of the CF.
The dashboard is displayed by default whenever you login to the administrative interface. To access the dashboard from a different configuration screen, select 'System' > 'Dashboard' from the left-hand navigation.
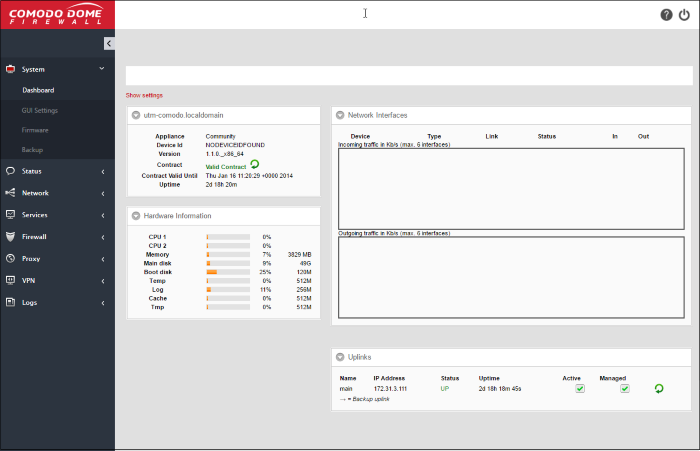
The dashboard displays the front panel of the device model and tiles which provide details on current hardware resource use, system information, currently running services, network information and uplink status.
- The device model panel indicates the connection status of the uplink, DMZ, LAN and WiFi network zone interface devices.
- Each tile can be expanded or collapsed by clicking the down arrow at the top left of it.
- The tiles can be positioned as per the desired lay out by just dragging and dropping them to the desired position.
- The plugins which control these panes can be configured by clicking the 'Show Settings' link at the top left of the interface. For more details on configuring the tiles, refer to the section Configure the Dashboard
Hardware Information
The Hardware information tile shows the hardware resource usage statistics of the Dome Cloud Firewall.
- CPU x - The usage of the CPU resources. In a multi-processor server, the load on each CPU is indicated separately, with the suffix 'x' denoting the CPU number.
- Memory - The usage of the system memory.
- Main disk - Usage of the root partition of the main disk for your account. The disk usage should not exceed 95%.
- Boot disk - Usage of the boot partition of the hard disk for your account. The disk usage should not exceed 95%.
- Temp - Usage of disk space in /tmp partition, allotted for temporary files for your account. The Temp space usage should not exceed 95%.
- Log - Usage of disk space allotted for log files for your account. The log space usage should not exceed 95%. The log files are available at /var/logs. If the log space usage exceeds the threshold, the administrator can move the log files to a different storage device and free the disk space.
- Cache - Usage of disk space for cache memory allotted for your account.
- Tmp - Usage of disk space by .tmp files created in Dome Cloud Firewall.
System Information
The System Information tile shows the host name and the network domain to which the Dome Cloud Firewall is connected in its title bar. The tile displays the general information about the appliance connected.
- Appliance - Indicates the type of the appliance
- Device ID - The identification number of the DCF
- Version - The version number of the DCF hosted for your account.
- Contract - Indicates whether the DCF license is valid. Clicking the circled arrow refreshes the information.
- Contract Valid Until - Expiry date of the license
- Uptime - Indicates the period for which DCF is up since the last reboot
Services
The Services tile shows the On/Off status and statistics of the services like Intrusion Detection, mail filters currently loaded to the appliance.
- Clicking on the Live Log in the title bar opens the Realtime logs screen.
- Clicking on the service name expands the pane below it showing the detailed statistics.
- Attacks Logged - Shows the number of attacks logged by the UTM
- SMTP Proxy - Shows the statics of mails in queue, total mails received, clean mails and infected mails that were rejected
- HTTP/HTTPS Proxy - Shows the statics of cache hits and misses
Network Interfaces
The network interfaces tile shows statistics of the network interface devices configured for your CF account and realtime updated graphical charts of incoming and outgoing traffic through these devices.
The table in the upper half of the tile displays realtime statics of each network device.
|
Network Interfaces - Column Descriptions |
|
|---|---|
|
Column Header |
Description |
|
Device |
The name of the network interface device. The font color in which the name is displayed indicates the network zone to which the device belongs: Red - External network like WAN, for Internet connection. Green - Local network to which workstations are connected, like LAN. |
|
Type |
The connection type of the device. |
|
Link |
Link status of the device. |
|
Status |
Running status of the device. |
|
In/Out |
Incoming/Outgoing traffic through the device. |
The lower half of the tile displays realtime
graphical charts of the incoming and outgoing traffic through the
devices selected from the list in the upper half. The administrator
can select the devices to monitor the traffic through them by
selecting the checkboxes beside the device names and deselect the
others in the upper half. The lines are displayed in colors depending
on the network zone to which the device belongs and the legend is
shown at the top right of each graph.
The Uplinks area displays a table of uplinks configured for your account through which the CF connects to internet. The table shows the connection status and running
status of each uplink and allows the administrator to enable or
disable them.
|
Uplinks - Column Descriptions |
|
|---|---|
|
Column Header |
Description |
|
Name |
The name of the uplinks configured by Comodo for your CF account. |
|
IP Address |
IP Address of the uplink. |
|
Status |
Running status of the uplink. The status column can have one of the following values:
|
|
Uptime |
The period for which the uplink is Up since the last reboot. |
|
Active |
Indicates whether the uplink is active. The administrator can switch the uplink between enabled and disabled states by selecting/deselecting this checkbox. |
|
Managed |
Indicates whether the uplink is managed by DCF or manually managed. The administrator can switch the management states by selecting or deselecting the checkbox. In Managed mode, the uplink will be continuously monitored and reconnected whenever there is a loss in connection. During testing or maintenance, the uplink can be switched to manual mode.
|
Dome CF uses dashboard plug-ins to
fetch the statistical information from different components of the CF and displays them as tiles in the dashboard. The plug-ins
gather the updated information periodically at specified intervals.
The administrator can configure the interval at which the statistical
information from each component is fetched and enable/disable the
plug-ins, and hence the corresponding tile, from the Dashboard
settings pane.
To open the Dashboard Settings pane
- Click 'Show Settings' link at the top left of the 'Dashboard'.
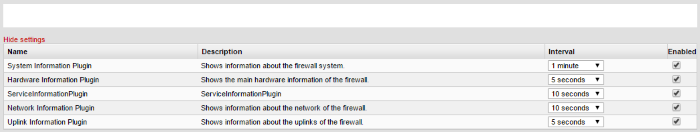
A table with a list of plug-ins used, their
descriptions and the current configuration will be displayed.
|
Dashboard Settings - Column Descriptions |
|
|---|---|
|
Column Header |
Description |
|
Name |
The name of the plugin. |
|
Description |
A short description of the plug-in. Indicates the component of DCF for which the plug-in fetches the information. |
|
Interval |
Enables the administrator to set the time interval at which the plug-in should refresh the information and show in the corresponding tile, be selecting the interval from the drop-down. |
|
Enabled |
The checkboxes enable the administrator to enable or disable the plug-in. Only the tiles corresponding to enabled plug-ins are displayed in the dashboard. If a tile needs to be hidden, the corresponding plug-in can be simply disabled. |
- Set the refresh intervals and enabled/disabled states of the plug-ins as desired
- Click 'Save' for your changes to take effect
- To close the settings pane, click 'Hide Settings' link at the top left.