


Realtime Logs
Comodo Dome Cloud Firewall can keep realtime logs of events from selected modules. The 'Live Logs' interface displays a list of modules and their current events. Events pertaining to selected modules are displayed in a scrolling window which is updated in real time. The window also allows you to filter logs to view events matching specific criteria.
- Click 'Logs' > 'Live' to open the 'Live Logs' interface:
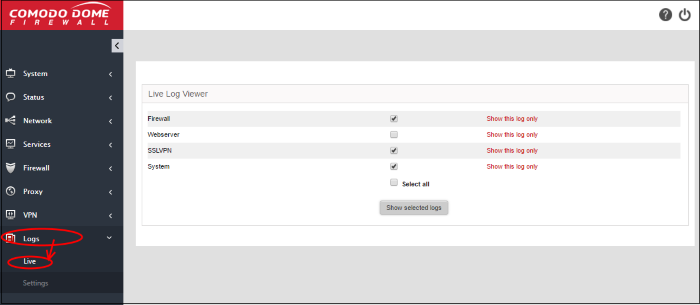
Realtime logs of the following modules are available:
- Firewall - Log of connection attempts that were allowed or blocked by the Firewall. Click the '+' button to view details such as IP / Port / MAC address of the source and destination, the connection protocol and more.
- SSLVPN - Displays events relevant to SSL VPN connections.
- System - Displays events concerning changes in DCF system settings and network configuration.
To view the live logs
- Click 'Logs' > 'Live' on the left-hand menu
- Select the module(s) whose events you want to view.
- Click 'Show selected logs'
|
Tip: You can add or remove modules in the live log viewer module too. |
The 'Live Log Viewer' will open in a new browser
window.
- Click
the '+' button at the right end of a log entry to view its details.
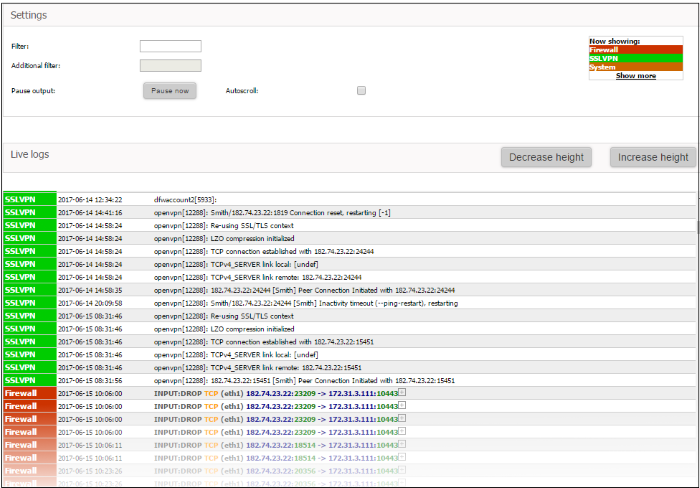
The 'Settings' pane of the live log viewer contains the filtering options and controls. The 'Live Logs' pane displays the list of the current events relevant to the selected modules in forward or reverse chronological order and is continuously updated realtime.
Settings
The Settings area contains the options and controls for the following:
Selecting Modules for viewing Logs
The modules for which the live loges are displayed, are listed at the top right of the settings pane. Each module name is highlighted by a color that indicate the log type. The log entries in the 'Live Logs' pane are highlighted with the respective color of the log type.
To add or remove modules to view the logs
- Click the 'Show More' link at the top right. A list of available modules will be displayed.
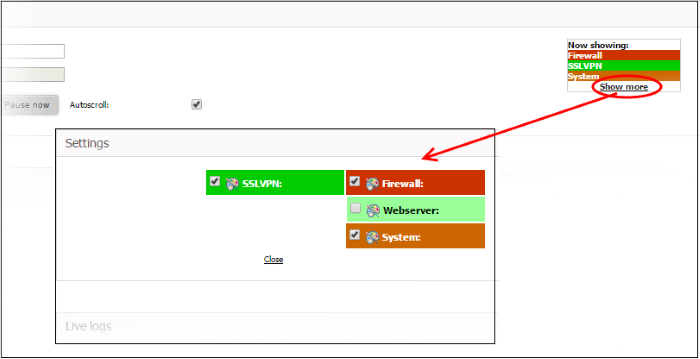
-
Select the modules for which you wish to view the live logs and deselect the modules for which you do not wish to view the live logs
The realtime log entries corresponding only to the selected modules are displayed in the lower pane.
The log entries displayed at the lower pane can be filtered by entering the filter criteria keywords.
To filter the log entries
- Enter the keyword for primary filter in the 'Filter' text field
- Enter the keyword for filtering the results from the primary filter, in the 'Additional filter' text field
The realtime log entries will be filtered and displayed based on the entered filter criteria.
Pausing and Resuming the log updates
By default, the 'Live Logs' viewer is dynamically updated with the current events that are pertinent to the selected modules. The administrator can temporarily stop the updates, for deeper analysis of certain events.
- To pause the updates click the 'Pause' now button.
- To resume updating, click 'Continue' button.
Autoscrolling the Live Log Viewer
The dynamically updated live logs viewer automatically scrolls upwards to show the chronologically added latest entries at the bottom of the list. If the autoscrolling is not enabled, the administrator can use the scroll bar at the right to move the list upwards to see the latest entries.
- To enable autoscrolling, select the 'Autoscroll' checkbox
|
Note: The 'Autoscroll' will be available only if the live logs viewer is configured to sort the entries in chronological order, that is the latest entries added to the bottom of the list. If the live log viewer is configured to sort the entries in reverse chronological order by selecting the option 'Sort in reverse chronological order' from the Settings interface, the 'Autoscroll' option will not be available. See 'Configure Log Settings' for more details on configuring the log viewer. |
Changing height of the Log Viewer
The 'Live Logs' area displays the list of events pertaining to the selected modules and services. Each entry contains the log type, the precise date and time of the event and the message describing the event. The administrator can increase or decrease the height of the live log viewer.
- To view more number of log entries at once, click 'Increase height' repeatedly. The height is increased by two entries for a single click.
- To view less number of log entries, click 'Decrease height'. The height is decreased by two entries for a single click.