Network Traffic
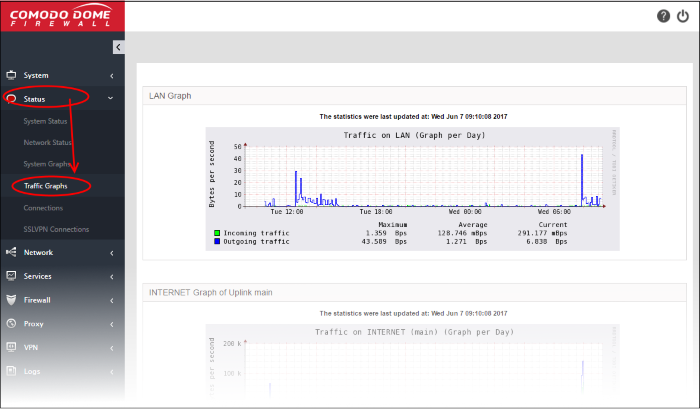
The 'Network Traffic Graphs' screen shows the amount of data passing through different network zones (LAN and internet zone). The number of graphs shown on this page depends on the number of network zones configured in Dome CF.
- To open the 'Traffic Graphs' interface, click 'Status' on the left then 'Traffic Graphs':

Click any graph to view traffic for the previous day, week, month and year. See the following links for more details:
The 'LAN Graph' shows traffic passing through the Local Area Network (LAN). Incoming and outgoing traffic are indicated with different colors.
- Green - Incoming traffic
- Blue - Outgoing traffic

The table below the graph shows maximum, average and current data traffic through the local network for the past day. Click the graph to view detailed traffic statistics for the past day, week, month and year.
The 'Uplink Graph' shows traffic through external network zones, like WANs, which are
connected to the internet.
|
Note: Separate graphs will be shown for each uplink configured for your account. |
Incoming and outgoing traffic are
indicated with different colors.
- Green - Incoming traffic
- Blue - Outgoing traffic

The table below the graph shows maximum, average and current traffic through the zone for the past day. Click the graph to view detailed traffic for the past day, week, month and year.


