Manage Network Monitors
Click 'Network Management' > 'Monitors'
- A monitor is a script which tracks events on SNMP devices and takes specific actions if its conditions are met. For example, you can set up a monitor to alert you if a device is switched off for a certain length of time.
- Network monitors are added to network profiles, which are in-turn applied to your SNMP devices.
- Click ‘Network Management’ > ‘Profiles’ to view and create network profiles.
- Click ‘Network Management’ > ‘Devices’ to view discovered SNMP devices.
- Click ‘Network Management’ > ‘Discoveries’ to create and run scans to find SNMP devices on your network.
- A single network monitor can be used in multiple network profiles. A single profile can include multiple monitors.
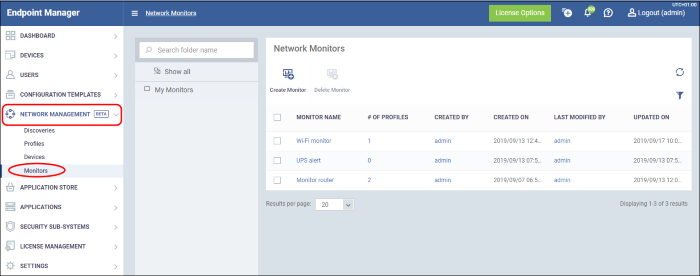
View and manage monitors
- Click 'Network Management' > 'Monitors'
|
Network Monitors - Column Descriptions |
|
|---|---|
|
Column Heading |
Description |
|
Monitor Name |
The label of the network monitor. |
|
No. of Profiles |
Show how many network profiles are using the monitor. Click the number to view a list of the profiles. |
|
Created By |
Admin that added the network profile. |
|
Created On |
Date and time the profile was added. |
|
Last Modified By |
Admin that most recently edited the profile. |
|
Updated On |
Date and time the profile was most recently modified. |
|
Controls |
|
|
Create Monitor |
Configure a new monitor. |
|
Delete |
Remove a monitor. |
- Use the funnel on the right to filter monitors by various criteria.
- Click
a column header to sort items by ascending / descending/
alphabetical order.
See the following links for more help:
Optional - Create a Sub-folder in the My Monitors Folder
- Click 'Network Management' > 'Monitors'
- To keep things organized, it is a good idea to create a sub-folder to house your SNMP monitors. You can create individual folders named after your target SNMP devices, or simply create a single folder for all SNMP monitors
- Place your mouse on the 'My Monitors' folder and click '+'
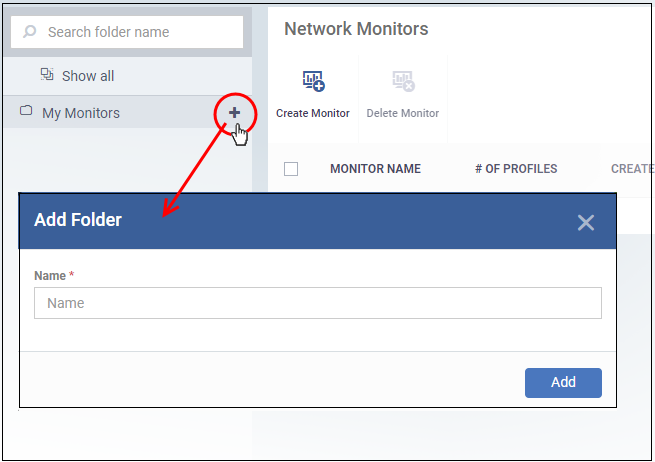
- Name - Enter an appropriate label for the sub-folder and click 'Add'
- Repeat the process to add more folders as required.
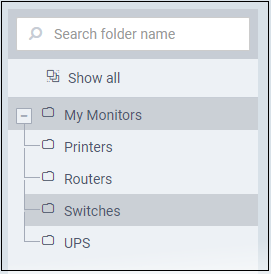
You can also add sub-folders to a sub-folder. You can now save network monitors in your new folders.
- Rename a sub-folder - Place your mouse over it, click the pencil icon, enter a new name and click 'Save'
- Delete a sub-folder - Place your mouse over it, click the trash can icon and confirm removal in the delete folder dialog.
- Click 'Network Management' > 'Monitors'
- Select the folder on the left in which you want save the monitor. All monitors are shown in ‘My Monitors’ irrespective of which you folder save them.
- Click ‘Create Monitor’
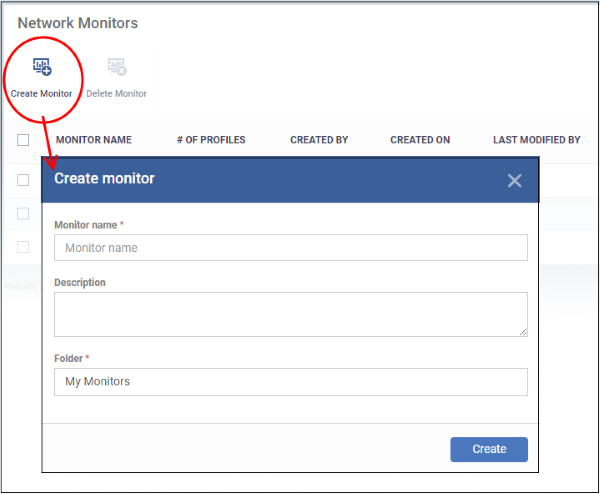
- Monitor name - Enter an appropriate label for the monitor, for example, ‘Monitor for Switches’
- Description- Any short notes about the monitor, if required.
- Folder - Select which folder you want to save the monitor. Default is ‘My Monitor’. Start typing the folder name and select from the suggestions.
- Click 'Create'. This opens the monitor, ready for you to configure.
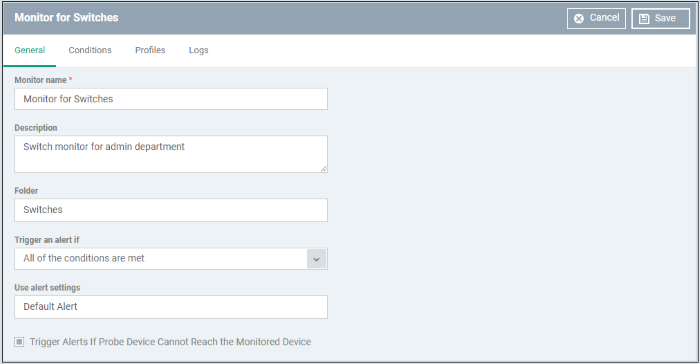
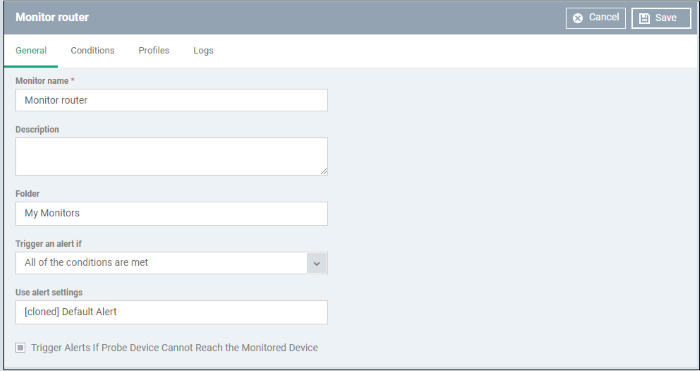
- Monitor name, description and folder are what you configured in the previous step. Update if required.
- Trigger an alert if - If the conditions that you configure in the ‘Conditions’ tab is breached, select when alert should be activated. The options are:
- All of the conditions are met - All rules that you configure in ‘Conditions’ tab is met.
- Any of the conditions are met - Any of the rules that you configure is met.
- Use alert settings - Select the alert type that should be triggered. See ‘Manage Alerts’ to configure custom alerts and manage them.
- Trigger Alerts if Probe Device Cannot Reach the Monitored Device - Alert is activated if the probe device(s) is not able to establish communication with the SNMP device.
- Click the ‘Conditions’ tab. This is where you can configure rules for the monitor:
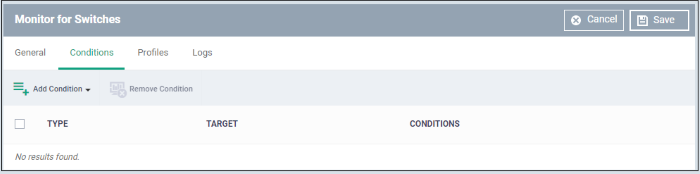
- Click 'Add Condition' and select the item you want to monitor:
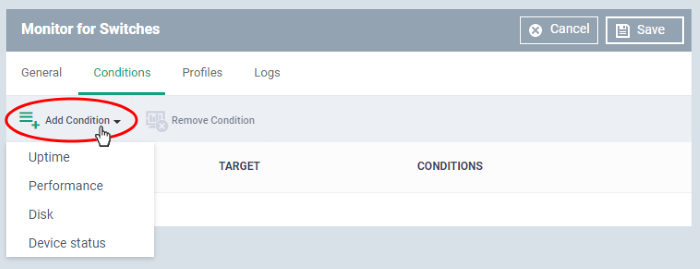
Next, specify the exact conditions of the rule:
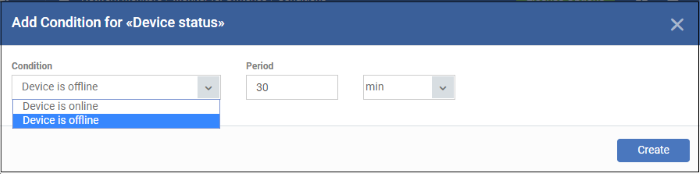
- Click 'Create' to add the rule to the monitor:
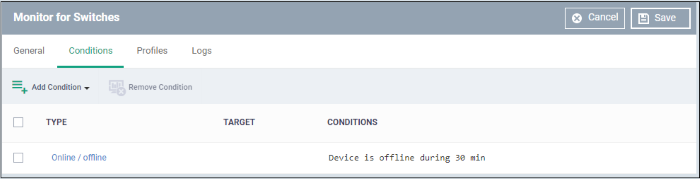
- Repeat the process to add more rules.
-
Click ‘Save’. The monitor will be available for selection while creating a network profile.
- Click 'Network Management' > 'Monitors'
- Click the monitor name
- Click ‘Edit’ at top-right
- The monitor update process is similar to creating a monitor explained above.
- ‘Profiles’ and ‘Logs’ screens are populated after the monitor is added to profiles. See ‘View Monitor Details’
- Click ‘Save’ to apply your changes.
If you delete a monitor, it will be removed from the applicable profiles also.
- Click 'Network Management' > 'Monitors'
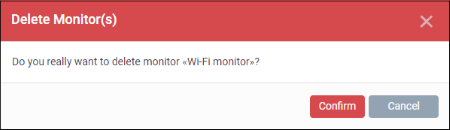
- Select the monitor and click ‘Delete Monitor’
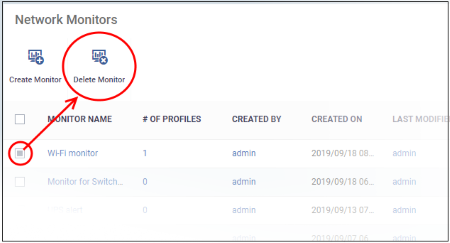
- Click ‘Confirm’
- Click 'Network Management' > 'Monitors'
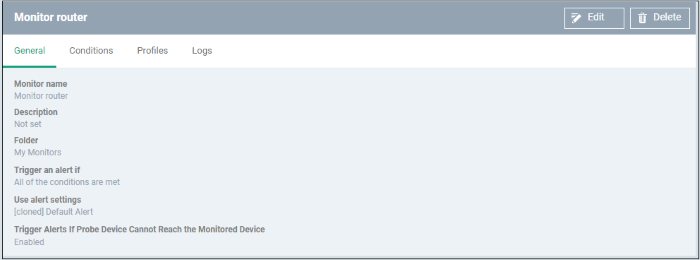
- Click the name of a network monitor. The monitor configuration interface opens at the 'General' tab:
The configuration interface lets you to:
Edit a Monitor
- See Edit Monitor section above.
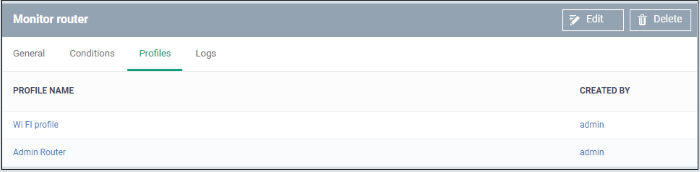
View all Profiles that use the Monitor
- Click 'Network Management' > 'Monitors'
- Click the name of a network monitor.
- Click the 'Profiles' tab
|
Network Profile - Table of Column Descriptions |
|
|---|---|
|
Column Heading |
Description |
|
Profile Name |
The profile in which the monitor is active.
|
|
Created By |
The admin that created the profile
|
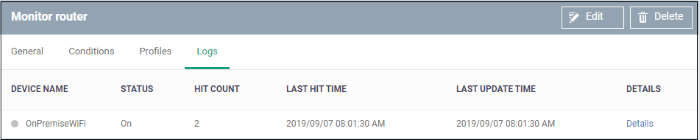
- Click 'Network Management' > 'Monitors'
- Click the name of a network monitor.
- Click the 'Logs' tab
The logs tab shows all instances where the conditions of the monitor were breached:
|
Network Monitor Logs - Table of Column Descriptions |
|
|---|---|
|
Column Heading |
Description |
|
Device Name |
The SNMP device on which the breach occurred.
|
|
Status |
Whether or not the monitor is currently active for the device. |
|
Hit Count |
Number of times the monitored conditions were breached. |
|
Last Hit Time |
Date and time the monitoring rule was last breached. |
|
Last Update Time |
Date and time when the information was last refreshed. |
|
Details |
|
View
Details of Network Monitor Logs
- Click the 'Details' link to view the details of the breaches of the monitoring conditions:
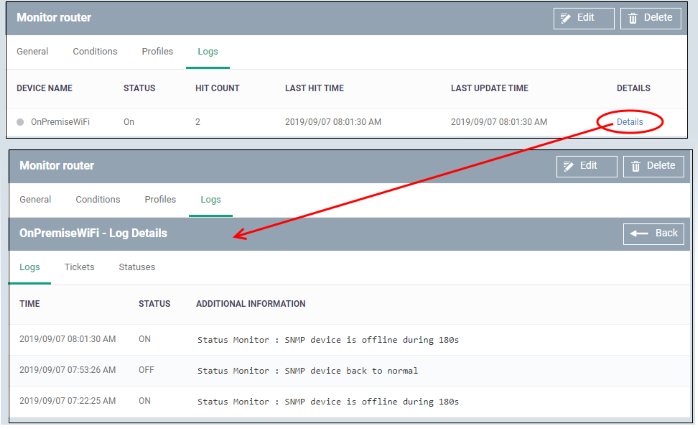
Details are shown under three tabs:
Logs - The date and time when the event occurred. Also shows the details of the monitoring rule that detected the event.
|
Network Monitoring Log Details - 'Logs' tab - Table of Column Descriptions |
|
|---|---|
|
Column Heading |
Description |
|
Time |
Date and time of the event. |
|
Status |
The current state of the monitor on the device:
|
|
Additional Information |
Details on the condition monitored and the breach |
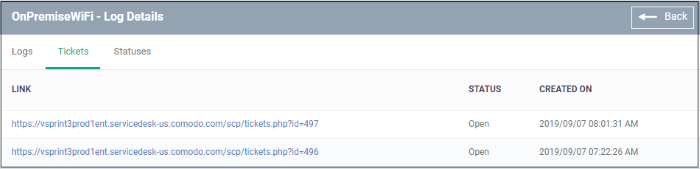
Tickets - Shows any service desk tickets which were automatically generated by the alert.
|
Network Monitoring Log Details - 'Tickets' tab - Table of Column Descriptions |
|
|---|---|
|
Column Heading |
Description |
|
Link |
A link to the support ticket created for the breach event.
|
|
Status |
Indicates whether the ticket is open or closed. |
|
Created On |
The date and time at which the ticket was raised. |
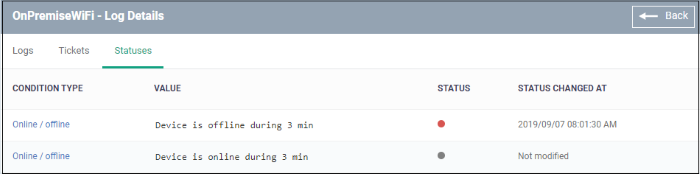
Statuses- Shows the current status of each condition in the monitor:
|
Network Monitoring Log Details - 'Statuses' tab - Table of Column Descriptions |
|
|---|---|
|
Column Heading |
Description |
|
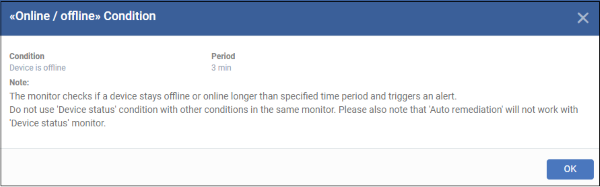
Condition Type |
The category of monitor. Click the type to view its exact conditions and thresholds. An example is shown below:
|
|
Value |
Condition set in the monitor. |
|
Status |
The current state of the monitored parameter on the device.
|
|
Status Changed at |
The date and time of the last change in state of the monitored parameter. |