


System Usage Statistics
The statistics interface displays real-time data about mail traffic, hardware and software usage and resource utilization.
- To open the 'Statistics' interface, click the 'System' tab and then the 'Statistics' sub tab.
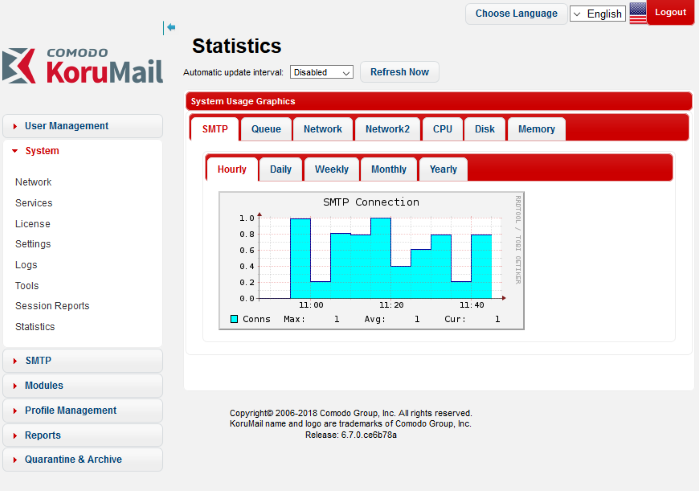
The administrator can set the update interval for the statistics or can instantly update the statistics to view the real-time usage graphs.
-
To set the update interval, choose the interval from the 'Automatic update interval' drop-down.
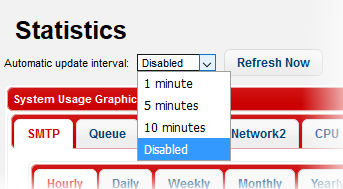
- To instantly update the statistics, click the 'Refresh Now' button.
The 'System Usage Graphics' area displays the
connection and usage statistics graphs under the following tabs:
- SMTP: A graphical representation of the number of SMTP connections between KoruMail and different mail servers during the selected time period. Shows data for both for incoming and outgoing mails.
- Queue: Displays the graphical representation of number of mails that were in queue for processing and delivering to the mail servers, during the selected time period.
- Network and Network2: Shows network utilization statistics through various network interfaces for the selected period.
- CPU: Shows the load on the KoruMail CPU over the selected period.
- Disk: Shows disk access levels over the selected period.
- Memory: Shows system memory usage over the selected period.
The 'SMTP' tab displays the numbers of SMTP connections made to different mail servers over the period chosen from the sub tabs:
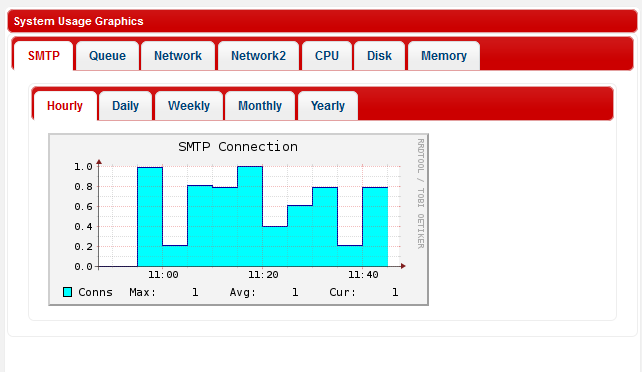
- Hourly - Shows the log of connections for the past one hour
- Daily - Shows the log of connections for the past 24 hours
- Weekly - Shows the log of connections for the past seven days
- Monthly - Shows the log of connections for the past four weeks
- Yearly - Shows the log of connections for the past twelve months
The numbers of maximum and average
connections within the selected period and the current number of
connections are displayed below the graph.
KoruMail receives all the emails and analyzes them for spam filtering, virus scanning, content filtering and so on, before delivering it to the mail servers. The 'Queue' tab displays the log of mails that were under processing and not delivered to the mail servers during the selected period.
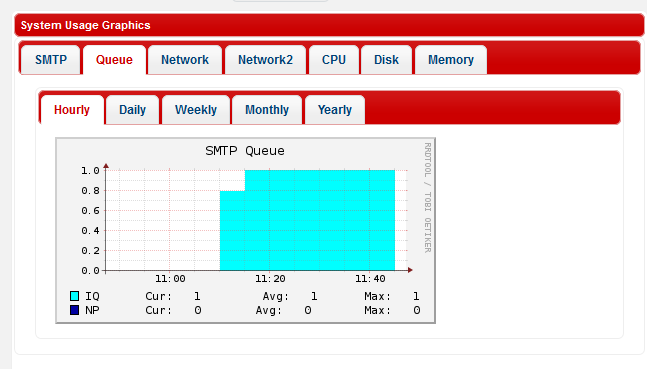
You can choose the time period for which you wish to see the logs from the sub tabs:
- Hourly - Shows the log of number of mails in queue for the past one hour
- Daily - Shows the log of number of mails in queue for the past 24 hours
- Weekly - Shows the log of number of mails in queue for the past seven days
- Monthly - Shows the log of number of mails in queue for the past four weeks
- Yearly - Shows the log of number of mails in queue for the past twelve months
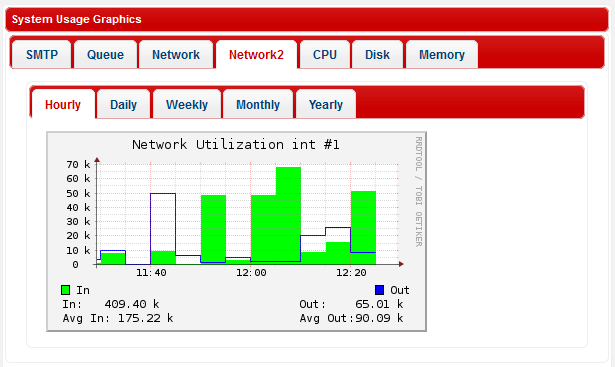
The Network tabs display the log of network resource utilization through the respective interface, for the period chosen from the sub-tabs.
- Hourly - Shows the log of network usage for the past one hour
- Daily - Shows the log of network usage for the past 24 hours
- Weekly - Shows the log of network usage for the past seven days
- Monthly - Shows the log of network usage for the past four weeks
- Yearly - Shows the log of network usage for the past twelve months
The incoming and outgoing traffic are represented with different colors in the graph.
- Green – Incoming traffic
- Blue – Outgoing traffic
The current incoming/outgoing traffic and the average incoming and outgoing traffic for the selected period of time are indicated below the graph.
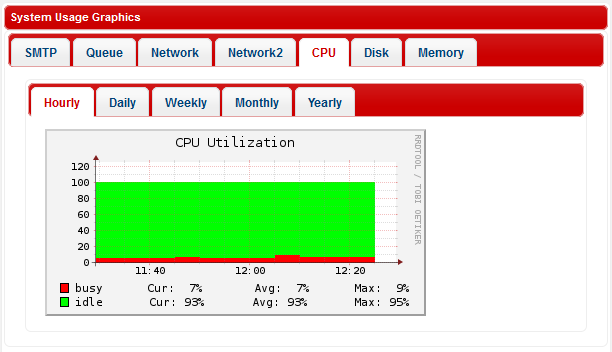
The CPU tab displays the log of load on KoruMail CPU, for the period chosen from the sub-tabs.
- Hourly - Shows the CPU usage for the past one hour
- Daily - Shows the CPU usage for the past 24 hours
- Weekly - Shows the CPU usage for the past seven days
- Monthly - Shows the CPU usage for the past four weeks
- Yearly - Shows the CPU usage for the past twelve months
The processes that are responsible for CPU usage are indicated with different colors.
- Green - Idle, CPU was not used by any of the processes
- Red - System processes
The table below the graph shows the current, average and maximum load of the CPU for the selected period from the respective processes.
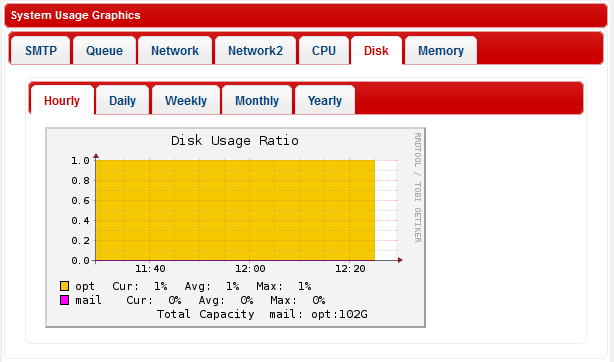
The 'Disk' tab displays a graphical representation of the log of the ratio of disk usage with respect to total disk space in KoruMail, for the period chosen from the sub-tabs.
- Hourly - Shows the disk usage for the past one hour
- Daily - Shows the disk usage for the past 24 hours
- Weekly - Shows the disk usage for the past seven days
- Monthly - Shows the disk usage for the past four weeks
- Yearly - Shows the disk usage for the past twelve months
The disk usage by different types of data are indicated with different colors.
- Yellow – Space occupied by system configuration
- Magenta - Space occupied by mail archive
The table below the graph shows the current, average and maximum disk usages for the selected period.
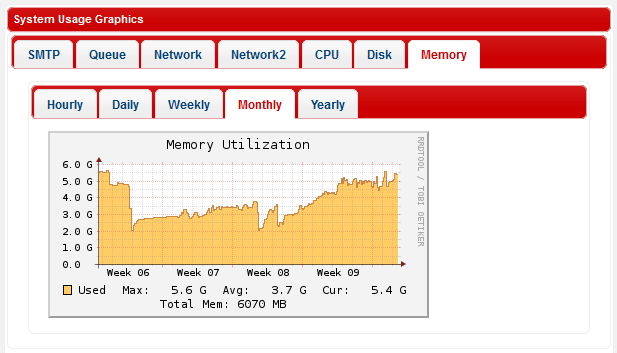
The 'Memory' tab displays a graphical representation of the usage of system memory of KoruMail, for the period chosen from the sub-tabs.
- Hourly - Shows the memory usage for the past one hour
- Daily - Shows the memory usage for the past 24 hours
- Weekly - Shows the memory usage for the past seven days
- Monthly - Shows the memory usage for the past four weeks
- Yearly - Shows the memory usage for the past twelve months
The maximum, average and current memory usage statistics are indicated below the graph.