Memory Tool
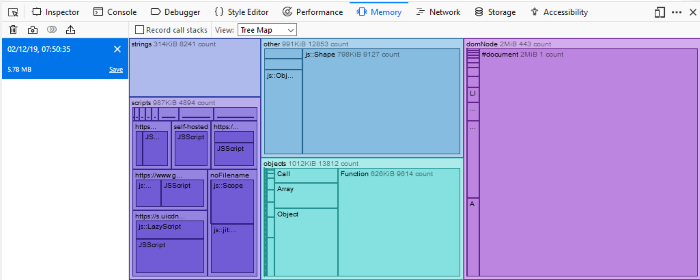
The 'Memory' tool lets you visualize how web-page elements use memory. Memory allocation is represented as a tree of nested rectangles.
To access the memory interface
- Click the hamburger button at top-right
- Select 'Web Developer' > 'Memory'
- Click the 'Take snapshot' button or click the camera icon at top-right

- Click 'Save' link to save the snapshot. Navigate to the locate to save the entry with the extension .fxsnapshot.
- Click 'X' next to entry to delete a snapshot.
- Click 'Import' to load the snapshot from the extension .fxsnapshot file.
- Click 'Compare snapshot'.
- Select the snapshot to use as basis then the snapshot to compare.

You also can store information about the subroutines of a computer program and view results in different ways along as group your data
- Record call stacks
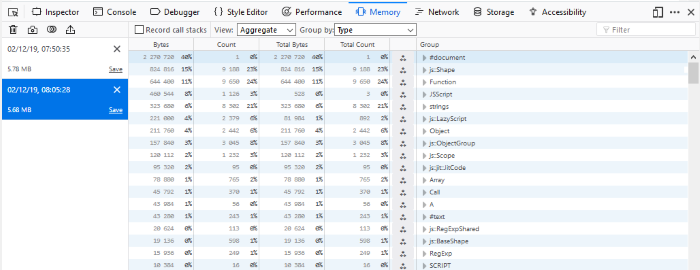
- View: Tree Map, Dominators, or Aggregate
- Group by: Type, Call Stack or Inverted Call Stack


