Remove Inconsistencies with HTML, CSS and Javascript
The debugger feature lets you analyze a web page's code line by line.
To open debugger element tool
- Click the hamburger button at the top-right
- Select 'Web Developer' then 'Debugger'

The debugger toolbar consists of:
- Pause/Resume - Halts or re-starts execution of the script you're debugging.
- Step Over - Steps across the current line of JavaScript code.
- Step Into - Steps into the function call on the current line of JavaScript code.
- Step Out - Runs the script until the current function exits.
- Script Chooser - This pop-up menu lets you select one of the running scripts in order to read its code, set breakpoints, and so forth.
- Script Filter - The script filter (which doubles as a search box) lets you type a string to filter what scripts should appear in the Script Chooser.
- Expand Panes - Expands or contracts the window to show or hide the sidebar panels.
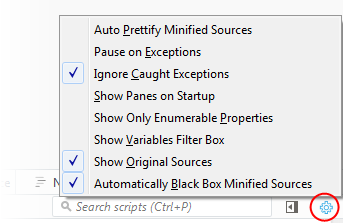
- Debugger Options - Pops-up a menu to configure the debugger.

- Auto Prettify Minified Sources – If enabled, the debugger will automatically detect minified JS files and pretty-print them.
- Pause on Exceptions-If enabled, execution of script will automatically pause whenever a JavaScript exception is thrown.
- Ignore Caught Exceptions - If enabled, the debugger will automatically pause the execution of the script whenever a JavaScript exception is thrown.
- Show Panes on Startup - If enabled, the debugger's two sidebar panes are visible when you first start the debugger; by default, they are not.
- Show Only Enumerable Properties - If enabled, allows you to filter the displayed list of variables after the "Filter variables" search box to will be added the variables panel.
- Show Variables Filter Box - If enabled, do not display non-enumerable JavaScript properties
- Show Original Sources - If enabled, allows you to use source maps to see the original source for code.
- Automatically Back Box Minified Sources - If enabled, URLs with 'min.js' at the end will automatically be black boxed.


