Open the Tools Console
Access the console interface
- Click the hamburger at the top-right
- Select ' Web Developer' > 'Toggle Tools'

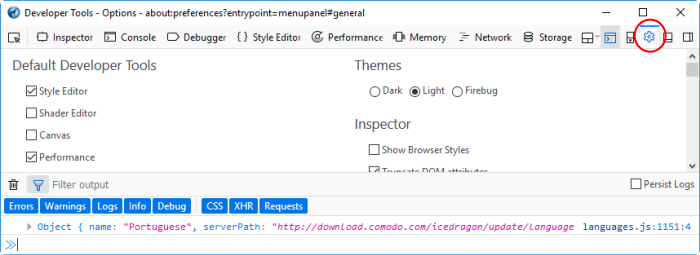
- Developer Tool - Options – Click the 'cog' icon on the right to set overall preferences:

- Default Developer Tools – Enable or disable tools using the check-boxes.
- Available Toolbox Buttons – Choose which tools are displayed on the toolbar.
- Theme - Switch between light and dark themes.
- Inspector
- Show browser styles – Determines whether or not the style applied by the browser will be displayed in the Inspector's Rules view
- Default color unit: drop down – Select the colors will be presented in the inspector. Available:
- Hex
- HSL(A)
- RGB(A)
- Color Names
- Web Console - Enable timestamps - If enabled, the console clears the output when you navigate to a new page
- Style Editor - View and manage original sources and auto-complete CSS
- Screenshot Behavior - Define how Ice Dragon should handle screenshots.
- Editor Preferences - Defines which items will be used in developer tools
- Detect indentation: Auto-indent new lines based on the current indentation
- Autoclose brackets
- Indent using spaces
- Tab size= 2 (By Default)
- Keybindings: drop down - Select CodeMirror keybindings or keybindings:
- Vim
- Emacs
- Sublime Text
- Advanced settings
Enable Source Maps – Maps your browser's inspector line numbers to the original source
- Show Gecko platform data - Displays Gecko platform symbols
- Disable HTTP Cache (when toolbox is open) - Allows you to disable session caching
- Disable JavaScript - Loads the current tab with JavaScript disabled
- Enable Service Workers over HTTP (when toolbox is open) – Allows you to service worker registrations from insecure web sites
- Enable browser chrome and add-on debugging toolboxes - Allows you to use developer tools in the context of the browser itself
- Enable remote debugging - Allows you to debug code running remotely in a different process or on a different device
- Enable worker debugging (in development) – Allows you to perform worker debugging in a different process or on a different device
- Restart your browser for the settings to take effect.
- Inspector – Analyze the layout of a web page and find/fix web page issues. It allows developers to see which elements in the source files (including server-side code) have produced the HTML markup to be rendered in the browser. Page Inspector also lets you modify CSS properties and DOM element attributes to see the changes reflected immediately in the browser.
- Web Console - Logged information and other error messages. Allows developers to upload/download files to/from server, edit text files directly on a server and much more.
- Debugger - Finds errors in other programs. A debugger allows a web developers to stop a program at any point and examine and change the values of variables.
- Style Editor- Allows developers to edit a style sheet to apply a style of your own choice to required elements.
- Performance - Allows developers to find and eliminate bottlenecks in your JavaScript code.
- Network - Displays a list of all the network requests made while loading the page.
-
Memory - Take a snapshot of the current page memory.
- Network - List all network requests made while loading the page.
- Other tools on the web developer toolbar are available:

- 'Select an iframes as the currently targeted document'. You can enable/disable it from the developer settings by clicking the cog icon at far top right. Lists all nested frames in the file and in the main document.
- Toggle split console – Displays an extra console underneath the web developer tools interface.
- Responsive Design Mode - Makes it easy to see how your designs will look on different sized screens such as mobile phones or tablets. Use the resize handle at the lower right of the content area to change the size of the content area.
- Storage - The storage inspector lets you inspect various types of storage that a web page can use.
- Accessibility - Assess what information is open to assistive technologies on the current page.
- Dock to side of browser window / Dock to bottom of browser window - Move and pin the panel to the side or top of the browser as per your preference.
- Show in separate window – Opens a separate developer tools.
- Click on the 'X' at the far right to close the tool bar.


