Browser Toolbox and Browser Content Toolbox
- The browser toolbox allows you to debug add-ons and the browser's own JavaScript code. In contrast, the normal toolbox only allows you to debug webpages.
- The browser toolbox's context is the entire browser rather than just single page on a single tab.
- Click the hamburger button at the top-right.
- Select 'Web Developer' > 'Browser Toolbox'.
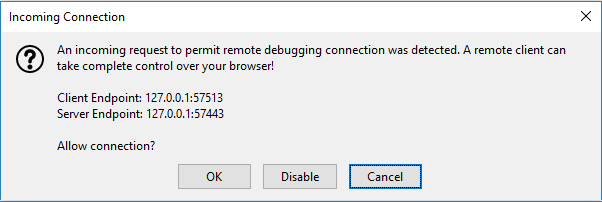
The browser toolbox will prompt you to enable or cancel the incoming request to remote debug your browser.

Click 'OK' to enable the remote connection.
- Enable browser toolbox, by clicking the 'Enable browser chrome and add-on debugging toolboxes' and 'Enable remote debugging'.

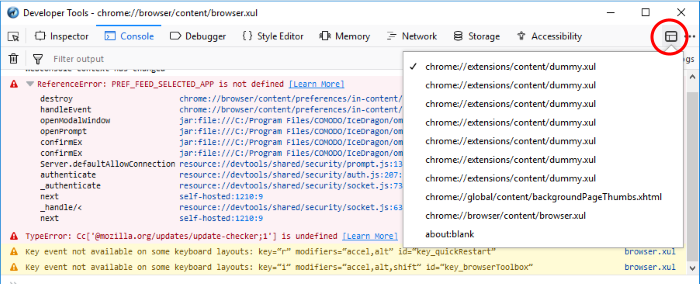
Target a specific window
In the toolbox, click the drop-down in the toolbar enabling any of the other windows.

Debugging pop-ups
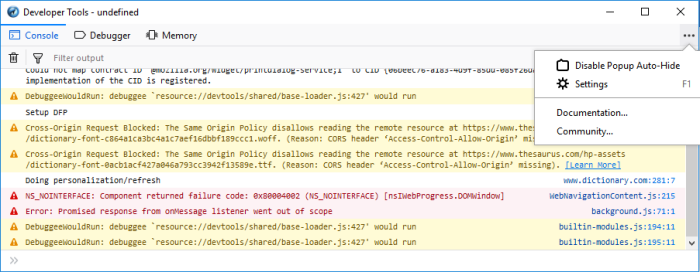
It is hard to debug pop-ups because the browser hides them as soon as you click outside them.
- To disable this behavior, click the toolbox menu and select Disable popup auto-hide


