Comodo Help
Find the desired product help
Comodo IceDragon

Comodo IceDragon

Version 65.0

English

Print Help Download Help
Web Developer Tools > Improve Web Page/Web Application Performance
  • Comodo IceDragon - Introduction
  • System Requirements
  • Download And Install Comodo IceDragon
  • The Basics
    • Start Comodo IceDragon
    • Set IceDragon As Your Default Browser
    • Set Your Homepage
    • Search The Internet
    • Change Search Options
    • Customize The Toolbar And The Menu
    • Open Recently And Most Visited Websites
    • View Browsing History
    • Set Fonts, Languages And Encoding
    • Configure IceDragon Updates
    • Page Action Menu
    • Portable Version
    • Uninstall IceDragon
  • Tabbed Browsing
    • Use Tabs
    • Customize Your New Tab Page
    • Tab Settings
  • Bookmarks
    • Create Bookmarks
    • Find And Edit Bookmarks
    • Manage Bookmarks
    • Bookmarks - Import, Export And Back Up
  • Privacy And Security
    • Private Browsing
    • Delete Browsing History And Configure History Settings
    • Allow/Block Pop-up Windows
    • Manage Cookies And Site Data
    • Block Websites From Tracking Your Browsing Activities
    • View And Manage Permission Settings
    • Configure Suggestions When Entering A Website Address
    • Manage Cache
    • Manage Add-on Permissions
    • Manage Passwords
    • TLS/SSL Certificates And Secure Connections
    • Manage SSL Certificates And HTTPS Security
      • View And Manage Certificates
        • Your Certificates
        • People
        • Server Certificates
        • Authorities
      • Configure Security Modules That Store Certificates And Passwords
    • Force Secure Connections
    • Website Security Indicators
    • Disable Accessibility Indicator
    • Configure IceDragon Performance And Browsing Settings
    • Network Proxy Settings
  • Downloads
    • Download A File
    • Change Download Location
    • View Download History
    • Clear Download History
  • Introduction To Add-ons
    • Download, Install And Configure Add-ons
      • Install Add-ons From Local Storage
      • Configure Updates To Add-ons
    • Manage Extensions
    • Customize The Appearance Of IceDragon
    • Manage Plugins
  • Tools And Other Features
    • Customize Applications For Opening Different File Types
    • Search Within Page Content
    • Form Autofill
    • Keyboard And Mouse Shortcuts For Comodo IceDragon
      • Mouse Shortcuts
      • Keyboard Shortcuts
    • Manage IceDragon In Safe Mode
    • Set Up Comodo IceDragon Sync Information
    • View Digital Rights Management
    • Improve IceDragon Performance Settings
    • Comodo Online Security Extension
    • View Task Manager
  • Web Developer Tools
    • Open The Tools Console
    • Inspect Page Elements
    • Use The Web Console
    • Remove Inconsistencies With HTML, CSS And Javascript
    • View And Run Style Sheets On A Web-page
    • Improve Web Page/Web Application Performance
    • Memory Tool
    • Network Monitoring
    • Storage
    • Accessibility
    • Use The Developer Toolbar
    • Use The WebIDE
    • Browser Toolbox And Browser Content Toolbox
    • Browser Console
    • Responsive Design Mode
    • Eyedropper
    • Run Experimental Java Scripts On Page
    • View Page Source
    • Service Workers
    • Connect Remote Device
    • Add More Web Development Tools
    • Work Offline
  • Troubleshooting
    • Error Your Connection Is Not Secure
  • Report A Bug

Improve Web Page/Web Application Performance


  • The performance tool lets developers optimize their code by testing the performance of a page within a set timeline.
  • On executing the code, the performance samples the state of the JS engine and records the code stacks at various time points.
    • The tool then calculates the time spent by the browser to execute each stack and displays a statistical report. The report allows web devs to analyze and identify bottlenecks in the code.


      To run the Performance

      • Click the hamburger at the top-right then
      • Select 'Web Developer' > 'Performance'


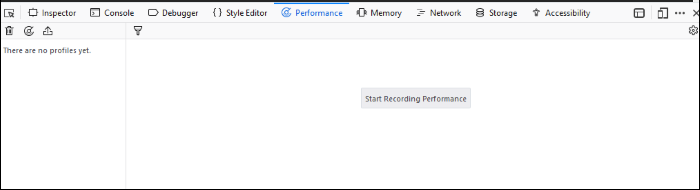
        • Execute your code in IceDragon and click 'Start Recording Performance' to commence the sample.
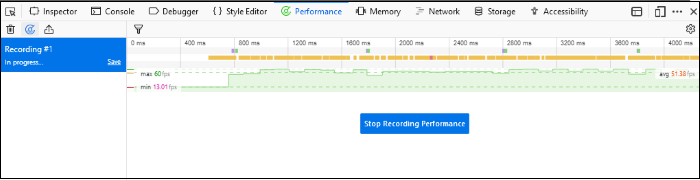
          • Leave the profile to record the samples for required time period and click the 'Stop' button to stop the recording.

          The 'Performance' will compile the results and display the report.


          Understand the Report


          The recording left hand pane of the report displays a list of captured profiles which can be loaded at any time. The right hand pane displays the currently loaded profile.


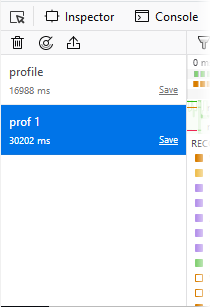
          • Click the 'clock' icon at the top-left of interface and repeat recording the samples and generate several profile reports.
          • Click the 'Import' and navigate the folder to upload the profiles
          • Click 'Clear' to remove all profiles.
          • 'Invert Call Tree' checkbox - If checkboxed, the profiler report will,
          • make a list of all stack frames with a Self Cost greater than zero: that is, stack frames which were actually execute when the sample was taken
          • order the list by the number of samples taken while in that stack frame
          • for each entry in the list, show the call stack backwards to the top-level function.

          The profile contains four main sections provides:

          • breadcrumb trail
          • frame rate timeline
          • timeline for platform code execution
          • detailed output of the JavaScript sampling profiler

          Breadcrumb trail


          The upper half of the loaded profile displays a time verses call stack size bar-graph of the profile. The call stack represents the amount of active functions at the time when the sample was taken.


          You can analyze the response for the stacks for a specific time range too. Selecting a portion of the graph, by dragging the mouse cursor displays a new tab above the graph indicating the selected portion. Clicking the new tab opens the enlarged view of the selected portion.


          To click and drag in the frame rate timeline or the sampling profiler timeline, will

          • highlight the section of the timeline
          • show samples that were recorded in that section
          • appear "+" in the toolbar at the top. Click the '+' to view the highlighted expanded section. You will see a separate breadcrumb nail the toolbar at the top.

          You can switch between the complete profile and the section using the breadcrumbs, zoom in on a subsection within the section.


          Frame rate timeline


          This item allows you to view the browser's responsiveness within the period covered by the profile. The x-axis is time over the profile period and contains three annotations: the target frame rate (always 60 frames per second), the average frame rate, and the lowest frame rate.


          Timeline for platform code execution


          Category

          Description

          Network

          Sending and processing network requests and responses.

          JIT

          JavaScript code compilation.

          GC

          Garbage collection.

          Inputs & events

          Events such as mouse or DOM events.

          Styles

          Parsing CSS.

          Graphics

          Includes handling reflows and repaints as well as WebGL.

          Storage

          Most often this is IndexedDB.

          Gecko

          Indicates items that doesn't fit into any of the other categories.


          Hover over the color key for a current category will fade all other categories.


          Detailed output of the JavaScript sampling profiler


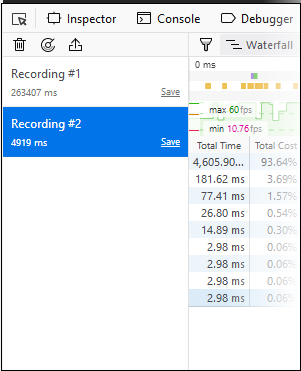
          The lower half display the details of the profile.


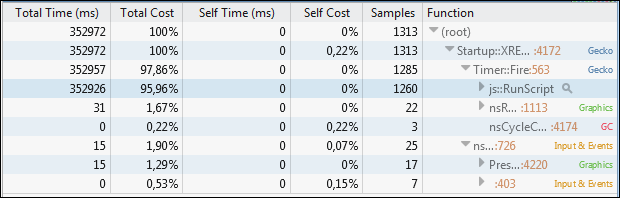
          The 'Total Time (ms)'display the break down view of the stacks that contained specific active functions and their share in total number of stacks in percentage in the first column, the number of stacks called by the functions in the second column and a tree structure view of the functions in the third column.


          The 'Total Cost' indicates the number of samples to be taken in which the corresponding "Function" appeared in the call stack.


          The 'Running Time' indicates the total number of samples executed within the recording time followed by the percentage of stacks that executed the active functions.


          The 'SelfCost' indicates the number of stacks that were called while executing the active functions, and not the stacks that called the function.


          The 'SelfTime (ms)'indicates the amount of time spent executing the function, exclusive of any functions called by this function in the percentage of stacks that executed the active functions.


          The 'Samples' indicates the number of samples to be taken in which the corresponding "Function" appeared in the call stack.


          The 'Function' displays the function name, source file, line number and domain that served the file. To debug a specific function, hover the mouse cursor over the function and click on the right arrow that appears at the end of the line.

          Our Products
          • Free Antivirus
          • Free Internet Security
          • Website Malware Removal
          • Free Anti-Malware
          • Anti-Spam (Free Trial)
          • Windows Antivirus
          • Antivirus for Windows 7
          • Antivirus for Windows 8
          • Antivirus for Windows 10
          • Antivirus for MAC
          • Antivirus for Linux
          • Free Endpoint Security
          • Free ModSecurity
          • Free RMM
          • Free Website Malware Scanner
          • Free Device Manager for Android
          • Free Demo
          • Network Security
          • Endpoint Protection
          • Antivirus for Android
          • Comodo Antivirus
          • Wordpress Security
          Cheap CDN
          • Bootstrap CDN
          • Semantic UI CDN
          • Jquery CDN
          • CDN Plans
          • CDN
          • Free CDN
          Enterprise
          • Patch Management Software
          • Patch Manager
          • Service Desk
          • Website Down
          • Endpoint Protection Solutions
          • Website Security Check
          • Remote Monitoring and Management
          • Website Security
          • Device Manager
          • ITSM
          • CRM
          • MSP
          • Android Device Manager
          • MDR Services
          • Managed IT Support Services
          • Free EDR
          Free SSL Certificate
          Support Partners Terms and Conditions Privacy Policy

          © Comodo Group, Inc. 2025. All rights reserved.