Comodo Help
Find the desired product help
Comodo IceDragon

Comodo IceDragon

Version 65.0

English

Print Help Download Help
Web Developer Tools > Network Monitoring
  • Comodo IceDragon - Introduction
  • System Requirements
  • Download And Install Comodo IceDragon
  • The Basics
    • Start Comodo IceDragon
    • Set IceDragon As Your Default Browser
    • Set Your Homepage
    • Search The Internet
    • Change Search Options
    • Customize The Toolbar And The Menu
    • Open Recently And Most Visited Websites
    • View Browsing History
    • Set Fonts, Languages And Encoding
    • Configure IceDragon Updates
    • Page Action Menu
    • Portable Version
    • Uninstall IceDragon
  • Tabbed Browsing
    • Use Tabs
    • Customize Your New Tab Page
    • Tab Settings
  • Bookmarks
    • Create Bookmarks
    • Find And Edit Bookmarks
    • Manage Bookmarks
    • Bookmarks - Import, Export And Back Up
  • Privacy And Security
    • Private Browsing
    • Delete Browsing History And Configure History Settings
    • Allow/Block Pop-up Windows
    • Manage Cookies And Site Data
    • Block Websites From Tracking Your Browsing Activities
    • View And Manage Permission Settings
    • Configure Suggestions When Entering A Website Address
    • Manage Cache
    • Manage Add-on Permissions
    • Manage Passwords
    • TLS/SSL Certificates And Secure Connections
    • Manage SSL Certificates And HTTPS Security
      • View And Manage Certificates
        • Your Certificates
        • People
        • Server Certificates
        • Authorities
      • Configure Security Modules That Store Certificates And Passwords
    • Force Secure Connections
    • Website Security Indicators
    • Disable Accessibility Indicator
    • Configure IceDragon Performance And Browsing Settings
    • Network Proxy Settings
  • Downloads
    • Download A File
    • Change Download Location
    • View Download History
    • Clear Download History
  • Introduction To Add-ons
    • Download, Install And Configure Add-ons
      • Install Add-ons From Local Storage
      • Configure Updates To Add-ons
    • Manage Extensions
    • Customize The Appearance Of IceDragon
    • Manage Plugins
  • Tools And Other Features
    • Customize Applications For Opening Different File Types
    • Search Within Page Content
    • Form Autofill
    • Keyboard And Mouse Shortcuts For Comodo IceDragon
      • Mouse Shortcuts
      • Keyboard Shortcuts
    • Manage IceDragon In Safe Mode
    • Set Up Comodo IceDragon Sync Information
    • View Digital Rights Management
    • Improve IceDragon Performance Settings
    • Comodo Online Security Extension
    • View Task Manager
  • Web Developer Tools
    • Open The Tools Console
    • Inspect Page Elements
    • Use The Web Console
    • Remove Inconsistencies With HTML, CSS And Javascript
    • View And Run Style Sheets On A Web-page
    • Improve Web Page/Web Application Performance
    • Memory Tool
    • Network Monitoring
    • Storage
    • Accessibility
    • Use The Developer Toolbar
    • Use The WebIDE
    • Browser Toolbox And Browser Content Toolbox
    • Browser Console
    • Responsive Design Mode
    • Eyedropper
    • Run Experimental Java Scripts On Page
    • View Page Source
    • Service Workers
    • Connect Remote Device
    • Add More Web Development Tools
    • Work Offline
  • Troubleshooting
    • Error Your Connection Is Not Secure
  • Report A Bug

Network Monitoring


  • The 'Network Monitoring' tool lets developers dynamically view network activity on a site.
  • For example you can start debugging a page in the web console, then switch to the network monitor to see network activity – all without reloading the page.

View page source

  • Click the hamburger button at the top-right
    • Select 'Web Developer' > 'Network' 
    • Click the stopwatch icon to run the performance analysis tool.

    The 'Network' tab loads the site twice. First with an empty browser cache, then again with a primed cache. This simulates the initial visit and a subsequent visit to the site.


    Results are summarized in the table and as a pie chart.

    • Click 'Back' to return to the network monitoring list

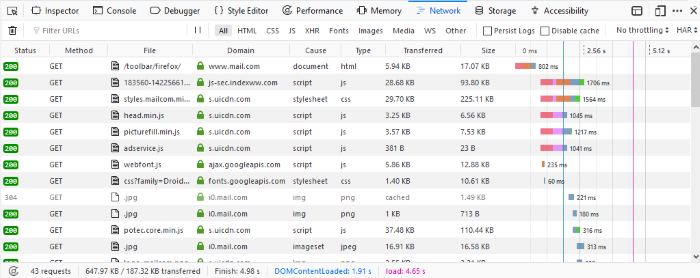
    The network table contains the following columns:

    • Status - The HTTP status code returned. Hover over the icon to see the exact code. Green color-coded icon - success (2XX codes), orange -  redirection (3XX), or red for errors (4XX and 5XX).
    • Method - Shows the HTTP request method.
    • File - Shows the basename of the file requested.
    • Domain - Shows the domain of the path requested.
    • Cause – Reason the network request appeared. (XHR request, , script, script requesting an image, etc.)
    • Type - Shows Content-type of the response.
    • Transferred – Displays the number of bytes transferred to load the resource.
    • Size - Shows the size of the response.
    • Timeline - Displays a timeline for the different parts of each request. 

    Each column can be sorted by ascending or descending. 


    The toolbar will be displayed at the top of the pane and allows you to switch between different pages:
    • Headers - Provides information about the request: URL, status code, the HTTP request and sent response headers.
    The filter header field allows you to filter the headers.
    • Cookies -Provides full details of any cookies sent with the request or response.
    • Params - Displays the GET parameters and POST data of a request.
    • Response - Displays the complete content of the response. Depending of the type of response, it will be displayed in HTML, JS, or CSS as text, JSON as an object, an image will be shown as a preview.
    • Timings - Provides detailed timeline bar for the request showing how the total wait time is split into the various stages.

    The developers can also sort their certain type of files by HTML, by JS, by XHR, by Fonts, by Images, by Media or by Flash type. Click the buttons in the Network toolbar to filter the list by type. This is also allows you to find out the total size and download time for a particular type of file.

    Our Products
    • Free Antivirus
    • Free Internet Security
    • Website Malware Removal
    • Free Anti-Malware
    • Anti-Spam (Free Trial)
    • Windows Antivirus
    • Antivirus for Windows 7
    • Antivirus for Windows 8
    • Antivirus for Windows 10
    • Antivirus for MAC
    • Antivirus for Linux
    • Free Endpoint Security
    • Free ModSecurity
    • Free RMM
    • Free Website Malware Scanner
    • Free Device Manager for Android
    • Free Demo
    • Network Security
    • Endpoint Protection
    • Antivirus for Android
    • Comodo Antivirus
    • Wordpress Security
    Cheap CDN
    • Bootstrap CDN
    • Semantic UI CDN
    • Jquery CDN
    • CDN Plans
    • CDN
    • Free CDN
    Enterprise
    • Patch Management Software
    • Patch Manager
    • Service Desk
    • Website Down
    • Endpoint Protection Solutions
    • Website Security Check
    • Remote Monitoring and Management
    • Website Security
    • Device Manager
    • ITSM
    • CRM
    • MSP
    • Android Device Manager
    • MDR Services
    • Managed IT Support Services
    • Free EDR
    Free SSL Certificate
    Support Partners Terms and Conditions Privacy Policy

    © Comodo Group, Inc. 2025. All rights reserved.