ROI Dashboard
Utilize this Return on Investment (ROI) dashboard to assess the efficiency and profitability of Xcitium products. The ROI dashboard directly quantifies the return on investment in Xcitium products relative to the initial investment cost.
For customers who have not yet availed of MDR or SOC services, the implication is that acquiring these services would result in significant profits and advantages. This tool facilitates the calculation of the number of alerts detected by each Xcitium component specific to the customer's account, along with the gains associated with these detected alerts relative to the total cost.
The values here mentioned are depends on the settings configured by the administrator here.

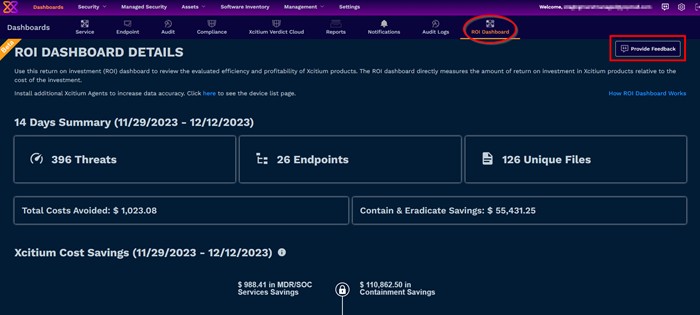
Provide Feedback
Click 'Provide Feedback' which will open https://xcitium.canny.io/customer-requests?selectedCategory=dashboards
in a new tab with dashboard as selected category.
You can do following things using this option
- Create a new post: We can create a new post in related category and provide your suggestion or new feature needed in the dashboard.
- Check existing post: You can check existing post created by yourself or others and know their status.
The new ROI Dashboard has following 5 sections:
14 Days Summary
The summary calculates last 14 days of threats detected in the platform including Today

- Threats: Total number of threats detected in the last 14 days.
- Endpoints: Total number of devices enrolled in the platform.
- Unique Files: The number of files containing threats detected in the last 14 days, including all components.
- Total Costs Avoided: This is calculated by adding the analysis and investigation percentages of the threats detected by all components and multiplying them by the hourly SOC analyst cost.
- Contain & Eradicate Cost: This is calculated by adding the analysis and investigation percentages of the threats detected by containment component and multiplying them by the hourly SOC analyst cost.
Xcitium Cost Savings
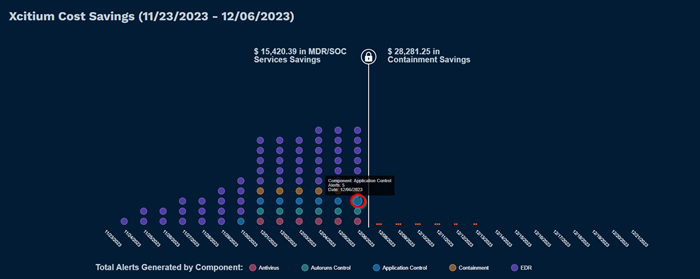
The graph explains the total savings calculated by Xcitium components to illustrate how much profit is saved and advantage by using the Xcitium components.

The graph contains 28 days of data in the section which has been divided into two parts. The first part on the left side shows the Actual customer data of threats detected and the second part on the right of the lock shows the forecasted data according to the past usage of the customer.
Each bubble or circle has details of component name, alert count and information.
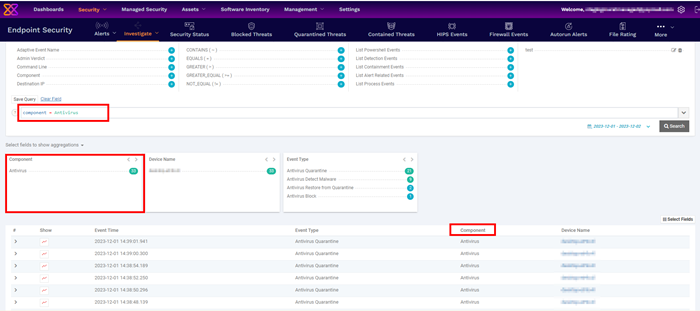
The left side part has clickable bubbles, which open the pre-defined queries in a new tab Event Search under Investigate with the query has the component and date filtered.
| ToolTip: The total number of alerts generated by components is displayed daily. Alert counts for the same day may vary on the ROI Dashboard and Alert Search pages due to time zone differences between your local time zone and GMT+ formats servers where data are stored. |

Alerts
The table lists the last 14 days including today and the total alerts detected on the day

- Time Period: Listing the last 14 days from now on
- Total Threats: Calculating the total alert count per day.
Notable Threats Eliminated
The graph illustrates the total number of alerts detected on that day and the prevention method used.
Hovering on any bubble will have detail of how much threats are eliminated by using MITRE Mitigation ID and prevention measures are displayed as tooltip.

- Time(day): Threat detection date
- Preventive Measure: The used method for prevention. Our components and MITRE IDs have been matched as the following:
Threat Elimination & MITRE Att&ck Stages
This section is populated after clicking the bubble and following details are explained

-
Date - bubble selected date of Threat detection
-
Threat Count - Total Eliminated Threat Count
-
Endpoints - Number of Endpoints Threat detected
-
Unique Files/Executables - Number of Unique files/Executable detected
-
MITRE Mitigation ID with clear description
Selecting the “Review on the Event Search Page” will open in a new tab Event Search under Investigate with the query has the component selected.

All events that occurred due to the selected component on that particular date will be listed.


