Search Events by Query
Click 'Security' > 'Endpoint Security' > 'Investigate' > 'Event Search'
-
The 'Event Search' lets you search for specific events using built-in and custom queries.
-
Xcitium ships with some useful sample queries to start with.
-
You can construct custom queries with required parameters and save them for future use.
-
You can also append additional search fields to a query from its own search results, and construct a new query.
-
Queries can also be created from 'Alerts' > 'Alerts Search' interface for searching events using file name and file path.
Open the 'Event Search' interface
-
Click 'Security' > 'Endpoint Security'
-
Place your mouse on the 'Investigate' tab and choose 'Event Search'
.png)
Query Pane
-
The top pane lets you create and use queries to search events
-
By default, no custom queries are defined, and all events logged for the past 3 days are shown.
-
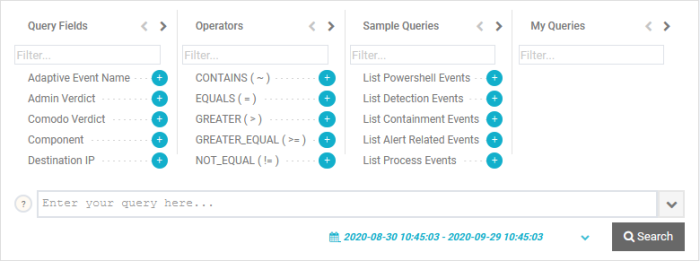
Use the 'Query Fields' and 'Operators' to build a custom event query.
-
'Sample Queries' are pre-defined, example queries. These can be used as standalones, or adapted to produce a more complex search. See Use sample queries for more details.
-
See Configure and run a custom query search for more help to create a query.
Results summary pane
-
The middle pane shows a summary of results as field tiles.
-
Each tile shows a summary of events grouped based on the values of the field.

-
The number beside each field value shows how many events contain the respective field value.
-
Click a number to automatically append the respective field value to the existing query.
-
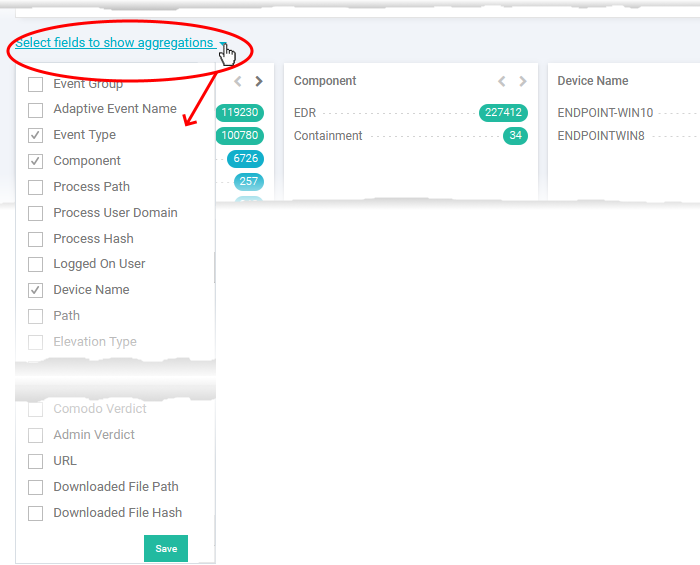
You can choose which fields to appear as tiles, by clicking 'Select fields to show aggregations'. See Configure results summary tiles to know more.
The results pane
-
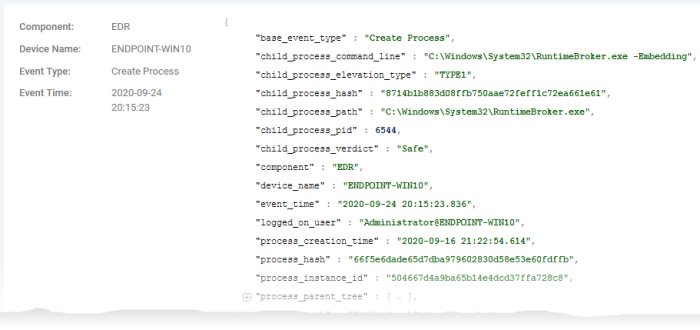
The lower pane shows the list of events resulted from your query, with full details.
-
Click a field value to automatically append the field / value as a search parameter to the query.
The following sections contain more help to:
Configure and run a custom query search
-
The event search interface lets you search for events by using field queries. The query string is of the format:
"[Field name] [Relational Operator] [Field value] AND [Field name] [Relational Operator] [Field value] AND … "
-
You can add any number of fields to a query.
Create a query
-
Click 'Security' > 'Endpoint Security' > 'Investigate' > 'Event Search'
-
Ensure that the search box at the bottom is blank
-
Add the query field
Click the '+' button beside a field name in the 'Query Fields' box to include it in the query.
To search for a specific field, start typing the field name in the 'Filter' box at the top and select from the suggestions.
-
Insert the operator.
By default, '=' operator appended to every field you enter
Select the relational operator from the 'Operators' box to change the default operator or manually enter the operator.
To search for a specific operator, start typing its name in the 'Filter' box at the top and select from the suggestions. The operator will be added next to the field name in the search box.
-
Enter the field value as match criteria after the operator.
-
Repeat the process to add more search fields to the query
-
Alternatively, click inside the search box, choose the field from the suggestions, manually add relational operator and value. Repeat the process to add more fields.
-
An 'AND' operator is automatically added between the subsequent fields.
-
Optional. Click the time-range drop-down at the bottom right and choose the time range to view the events occurred within that period
An example is shown below:

You can save the query if you plan to re-use the query often.
Save the query
Click 'Save Query' and enter a label for the query, shortly describing its purpose
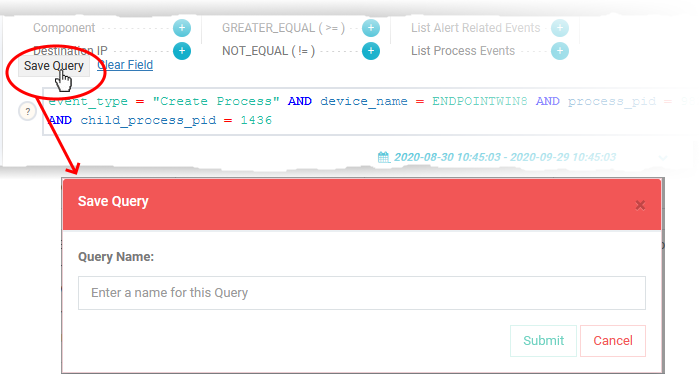
Click 'Submit'
Your saved queries are listed in the 'My Queries' box. You can click on any saved query at anytime to run a search.
-
Click 'Search' to view the events. All events that match the query are shown as a list in the lower pane. See View query results for more details on the results pane.
Xcitium ships with a set of built-in queries that are often used for data analysis by admins. These also serve as starting points to create more complex queries.
Use a sample query
-
Click the '+' button beside a query name in the 'Sample Queries' box
To search for a specific query, start typing its name in the 'Filter' box at the top and select from the suggestions.
-
Click 'Search' to view the results
You can refine the search by adding more fields from the results and save it as a new query.
The middle pane shows the summary of your search results:
Each tile shows a summary of
events grouped based on the values of the field.

The number beside each field value shows how many events contain the respective field value
-
Click a field to automatically append the respective field value to the existing query
-
You can choose which fields to appear as tiles, by clicking 'Select fields to show aggregations'. See Configure results summary tiles to know more.
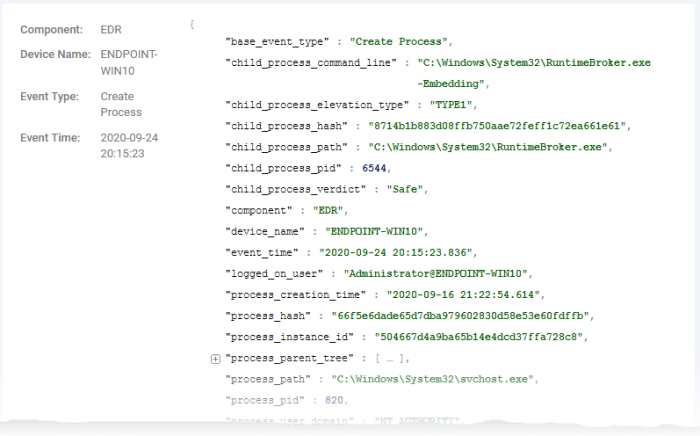
The lower pane shows the list of events that match your query with all field values relevant to the event:
-
Click on any field value to add the field and value to the existing search or create a new query with that respective field value.
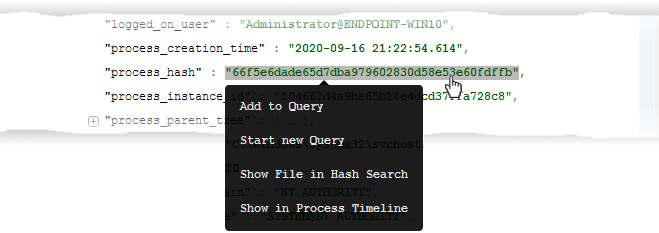
The available options depend on the field type:
-
Add to Query - Appends the field and the value to the existing query to refine the search. Click 'Search' again to run the search with the new query and / or 'Save Query' to add the query to 'My Queries'.
-
Start new Query - Creates a new query with the selected field and value as search parameters. You can refine the query by adding new search parameters.
-
Show File in Hash Search - Applies only to 'file hash' and 'process hash' fields. Opens the 'Security' > 'Endpoint Security' > 'Investigate' > 'Hash Search' screen with the details of the chosen file or the parent file of the chosen process and events generated by the file. See Search Events by File Hash to read more about the details shown on this page.
-
Show in Process Timeline - Applies only to 'process hash' field. The process time line chart of the device opens with the specific process pre-selected. The time line includes the events from 30 minutes before the selected event to 30 minutes after the selected event. See Process Timeline to read more about process timeline.
Configure results summary tiles
You can select the field tiles showing results summary. Each field tile shows the numbers of events with same values for the respective field.
-
Click 'Select fields to show aggregations' on the left
-
Select the field tiles to appear in the results summary from the drop-down.
-
Click 'Save'


