- Introduction To Xcitium Enterprise - Endpoint Protection Platform
- The Admin Console
- The Dashboards
- CNAPP Dashboard
- ROI Dashboard
- Devices And Device Groups
- Manage Device Groups
- Manage Devices
- Add New Devices
- Manage Windows Devices
- View And Edit Device Name
- View Summary Information
- View Network Information
- View And Manage Profiles Associated With A Device
- View Maintenance Windows Associated With A Device
- View And Manage Applications Installed On A Device
- View The Files On A Device
- View Exported Configurations And Import Profiles
- View MSI Files Installed On A Device Through Xcitium
- View And Manage Patches For Windows And 3rd Party Applications
- View Antivirus Scan History
- View And Manage Device Group Memberships
- View Device Logs
- Manage Mac OS Devices
- Manage Linux Devices
- Manage Android Devices
- Manage IOS Devices
- View User Information
- Remote Management Of Windows And Mac OS Devices
- Remotely Manage Folders And Files On Windows Devices
- Manage Processes On Remote Windows Devices
- Manage Services On Remote Windows Devices
- Use The Command Prompt On Remote Windows Devices
- View Event Logs On Remote Windows Devices
- Apply Procedures To Windows And Mac Devices
- Remotely Install And Manage Packages On Windows Devices
- Remotely Install Packages On Mac OS Devices
- Remotely Install Packages On Linux Devices
- Send Enrollment Link To IOS Devices
- Generate An Alarm On Android Devices
- Remotely Lock Mobile And Mac OS Devices
- Wipe Selected Mobile And Mac Devices
- Assign Configuration Profiles To Selected Devices
- Set / Reset Screen Lock Password For Mobile Devices
- Update Device Information
- Send Text Messages To Mobile Devices
- Restart Selected Windows Devices
- Change A Device's Owner
- Change The Ownership Status Of A Device
- Add Custom Notes And Tags On Devices
- Remove A Device
- Generate Device List Report
- Manage Isolate And Release From Isolation
- Bulk Enrollment Of Devices
- Download And Install The Remote Control Tool
- Cloud Workloads
- Cloud Assets
- Cloud Security
- Users And User Groups
- Manage Users
- Manage User Groups
- Configure Role Based Access Control For Users
- Configuration Templates
- Create Configuration Profiles
- Profiles For Android Devices
- Profiles For IOS Devices
- Profiles For Windows Devices
- Create Windows Profiles
- Associated Devices Settings
- Antivirus Settings
- Communication Client And Xcitium Client - Security Application Update Settings
- File Rating Settings
- Firewall Settings
- HIPS Settings
- Containment Settings
- Maintenance Window Settings
- VirusScope Settings
- Xcitium Verdict Cloud
- Global Proxy Settings
- Client Proxy Settings
- Agent Discovery Settings
- Communication Client And Xcitium Client - Security Application UI Settings
- Logging Settings
- Client Access Control
- External Devices Control Settings
- Monitors
- Procedure Settings
- Remote Control Settings
- Remote Tools Settings
- Miscellaneous Settings
- Script Analysis Settings
- Data Loss Prevention Settings
- Patch Management Settings
- Performance Settings
- Thumbnails Settings
- Chat Settings
- Applications Settings
- Import Windows Profiles
- Create Windows Profiles
- Profiles For Mac OS Devices
- Create A Mac OS Profile
- Antivirus Settings For Mac OS Profile
- Certificate Settings For Mac OS Profile
- Restrictions Settings For Mac OS Profile
- VPN Settings For Mac OS Profile
- Wi-Fi Settings For Mac OS Profile
- Remote Control Settings For Mac OS Profile
- External Device Control Settings For Mac OS Profile
- Valkyrie Settings For MacOS Profile
- Procedure Settings For Mac Profiles
- Monitor Settings For Mac OS Profile
- Create A Mac OS Profile
- Profiles For Linux Devices
- View And Manage Profiles
- Edit Configuration Profiles
- Manage Default Profiles
- Manage Alerts
- Manage Procedures
- View And Manage Procedures
- Create A Custom Procedure
- Combine Procedures To Build Broader Procedures
- Review / Approve / Decline New Procedures
- Add A Procedure To A Profile / Procedure Schedules
- Import / Export / Clone Procedures
- Change Alert Settings
- Apply Procedures To Devices
- Edit / Delete Procedures
- View Procedure Results
- Manage Monitors
- Data Loss Prevention Rules
- Create Configuration Profiles
- Security Systems
- View Alerts And Security Events
- Investigate Events
- Endpoint Security Status
- View And Manage Blocked Threats
- View And Manage Quarantined Items
- View Contained Threats
- View And Manage Autorun Items
- Manage File Trust Ratings On Windows Devices
- View List Of File Verdicts
- View History Of External Device Connection Attempts
- Data Loss Prevention Scans
- Network Management
- Software Inventory
- Management Settings
- Configure Xcitium Enterprise
- Email Notifications, Templates And Custom Variables
- Xcitium Enterprise Portal Configuration
- Dashboard Settings
- Cloud Security Settings
- CTEM Settings
- Data Protection Templates
- View Version And Support Information
- Alert Notification Settings
- Appendix 1a - Xcitium Services - IP Nos, Host Names And Port Details - EU Customers
- Appendix 1b - Xcitium Services - IP Nos, Host Names And Port Details - US Customers
- Appendix 2 - Pre-configured Profiles
- Appendix 3 - Default Xcitium Security Policy Details
- About Xcitium
 Cloud Workloads
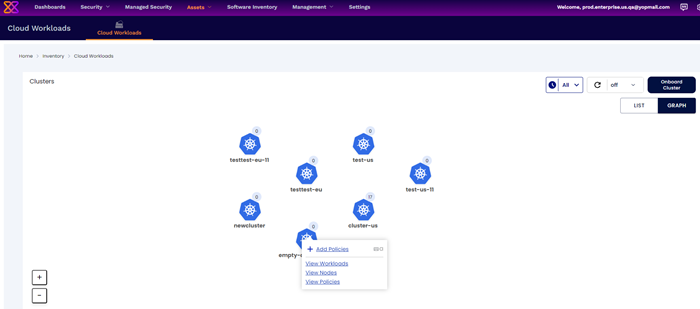
After onboarding your Cluster (managed/ unmanaged), you should be able to visualize cloud workloads with metrics and alerts. You can interact with the cloud workload for monitoring and understanding your application. For example, you can visualize connectivity between microservices and then can instantly drill into the per-layer alerts generated, assess compliance and investigate incidents, all without leaving Cloud Workloads Screen.
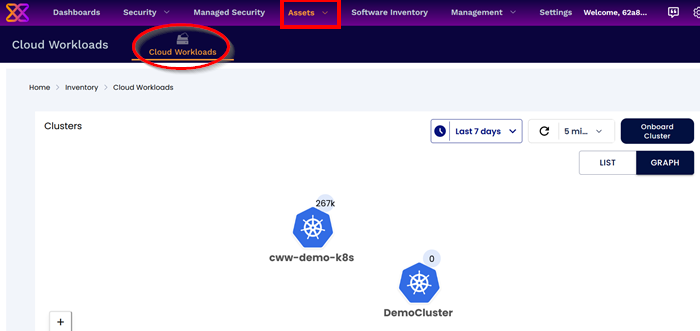
- Click 'Assets'
- Click 'Cloud Workloads'
- Navigate to Cloud Workloads screen under Inventory to view the clusters that have been onboarded
- View can be freely switched between LIST and GRAPH as needed
- Please check this page for more information on how to Onboard the Cluster.
- Clicking on any of the clusters in the Cloud Workloads screen gives more information about the cluster
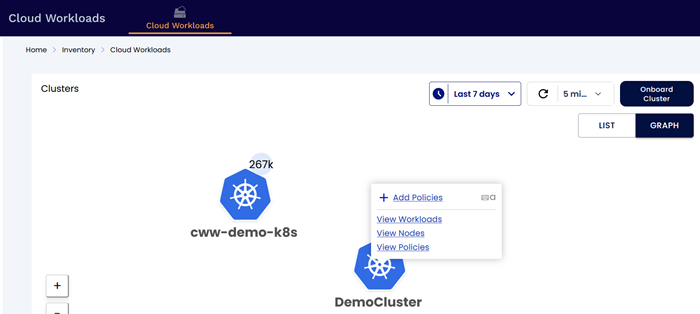
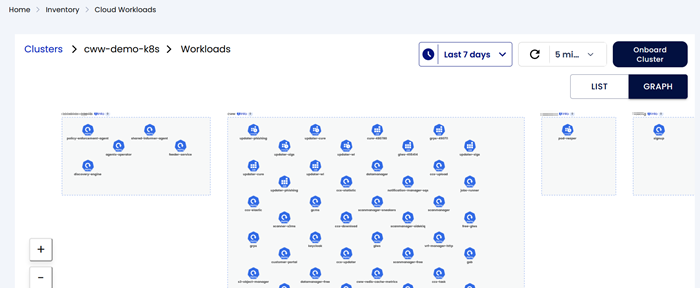
- Click on View Workloads to view the workloads present in the cluster classified according to the namespaces they are present in:
Navigate back to the Clusters screen and select a cluster and then click on View Nodes. In the nodes screen, we can view the nodes used by the cluster.
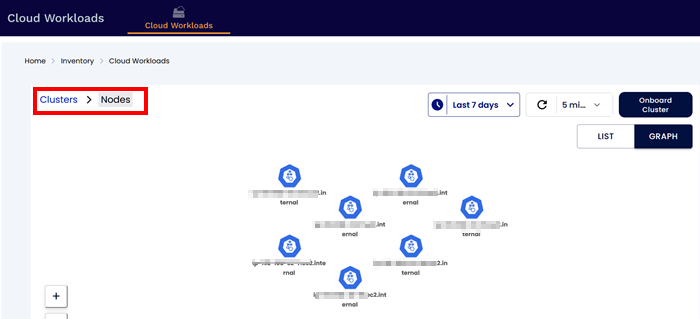
- We can also double click on the node to view the workloads running in them
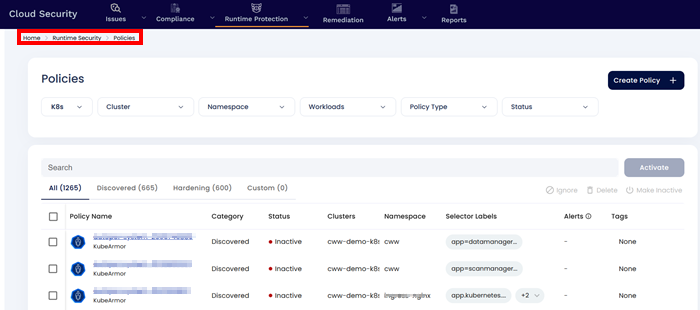
- View Policies can be clicked to jump to the policies screen to show the policies for the selected cluster or workload:
