The Dashboards
-
Click 'Dashboards' > 'Dashboards' in the top menu to open this page.
The dashboard shows real-time data about the operating system, connection status and security posture of all devices enrolled to Xcitium Enterprise. It contains pie charts showing device types, platforms, ownership, scan status and compliance status. The dashboard also lets you view Xcitium Verdict Cloud results, view notifications, and generate reports.
The dashboard is divided into seven sections:
- Xcitium Dashboard - Charts which show the summary of alerts and security
events detected on the managed devices by Xcitium. This
includes events from the antivirus, containment, and EDR components.
See the Xcitium Dashboard section for more details.
-
Audit - Charts which show the operating systems and client versions installed on devices on your network. Also contains charts which show the types of devices in your network, and whether the devices are personal or corporate. See the Audit section for more details.
-
Compliance - Statistics which detail how compliant your devices are with Xcitium security policies. For example, device connection status, devices with viruses, devices with blacklisted applications, rooted and jailbroken devices, and device scan status. See Compliance for more details.
-
Xcitium Verdict Cloud - A summary of verdicts on unknown files submitted to the Xcitium Verdict Cloud file analysis system. See Xcitium Verdict Cloud for more details.
-
Reports - A list of all reports generated by Xcitium. You can also create new reports from here. See Reports section for more information.
-
Notifications - A list of notifications sent to the administrator by Xcitium. See Notifications for more details.
-
Audit Logs - A list of actions taken on managed devices by admins and staff. Example actions include applying profiles, remote installation of packages and more. See Audit Logs for more details.
-
Click 'Dashboards' on the top
-
Click the 'Endpoint' tab
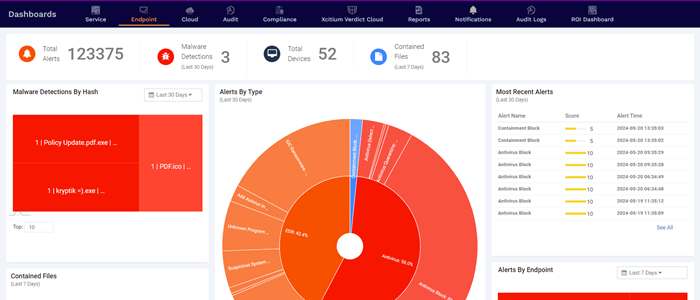
The top panel shows overall security summary:

-
Total alerts - The number of alerts generated by EDR and security events recorded for the past thirty days.
-
Malware detections - The number of threats identified by Antivirus on the managed endpoints, for the past thirty days
-
Total devices - The count of Windows devices currently managed by Xcitium
-
Contained Files - The number of executable files and applications run inside the containment on the managed Windows devices. These include files run by containment rules in the profile active on the devices and applications run manually inside the containment
The dashboard shows the following charts:
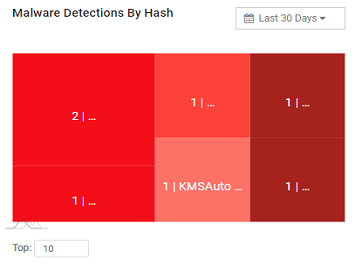 |
Malware Detections by Hash:
|
|
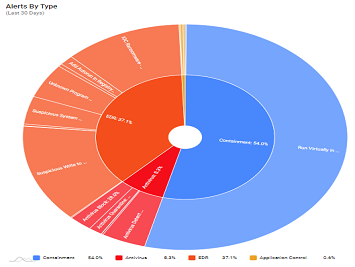
Alerts By Type The doughnut chart shows the breakup of alerts generated by EDR and various security components and types of alerts generated by each component.
|
 |
|
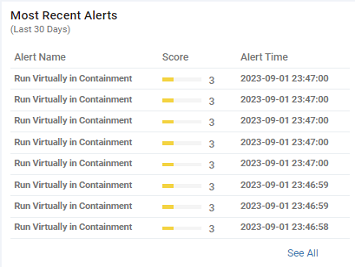
Most Recent Alerts
|
|
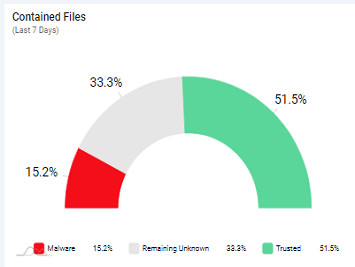
Contained Files Shows a breakup of files run inside the container on the endpoints, grouped based on their trust rating, for the past seven days.
|
|
|
|
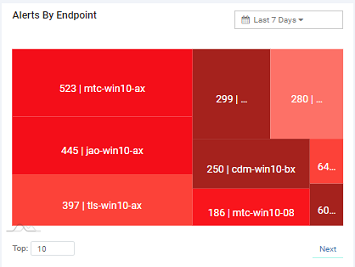
Alerts by Endpoint Shows the summary of security events and alerts, grouped by devices. The number on the left indicates the count of events generated on the device.
|
|
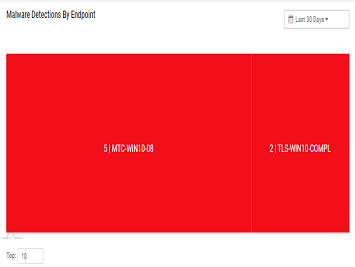
Malware Detections by Endpoint
|
 |
|
|
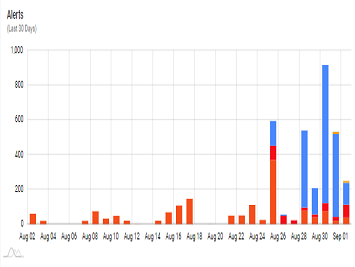
Alerts The timeline graph shows the numbers of alerts generated and events detected by various security components on different days.
|
-
Click 'Dashboards' on the top
-
Select the 'Audit' tab
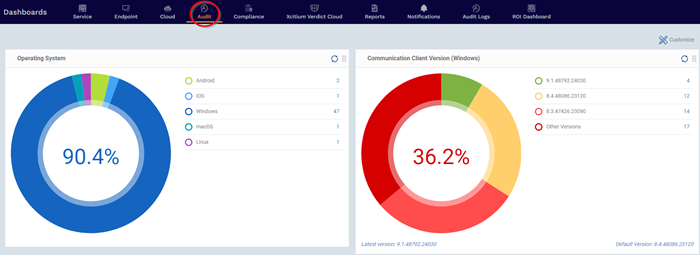
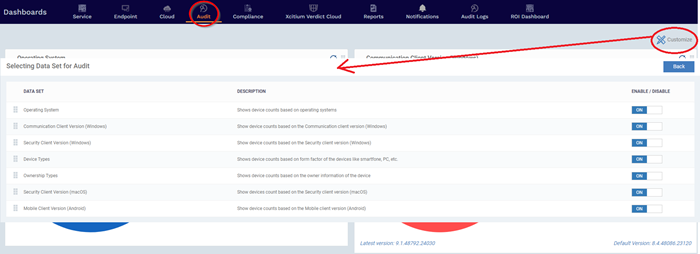
- Click 'Customize' at top-right if you want to change which charts are shown on the page
-
Use the 'On/Off' switches to add or remove charts from the dashboard
-
The numbers at the top right of the 'Customize' icon
.png) shows the number
of charts removed from the default view
shows the number
of charts removed from the default view
-
Click and drag the grid icon
 at top right of a tile to change its
location.
The 'Audit' dashboard contains the
following tiles:
|
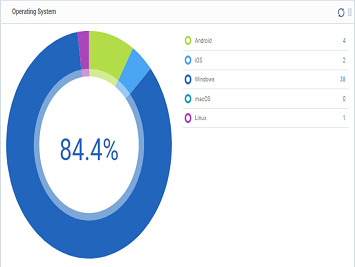
Operating System Shows enrolled devices by operating system. Place your mouse cursor over a sector or the legend to see further details.
For example, clicking on 'Android' in the legend will open the 'Device List' page displaying the list of Android devices. See Manage Devices for more details. |
 |
|
|
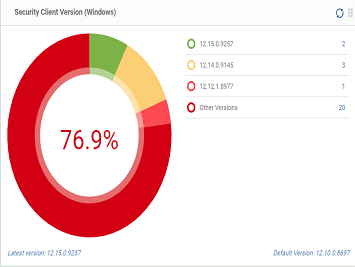
Security Client Version (Windows)
Update to the latest version - Click the number, select the target devices, then click 'Install or Manage Packages'. |
|
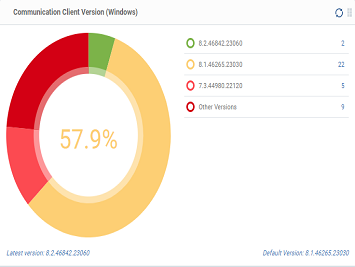
Communication
Client Version (Windows) The versions of Communication Client installed on Windows devices on your network. This is the agent which sends updates to the Xcitium console.
See Remotely Install and Manage Packages on Windows Devices for more details. |
 |
|
|
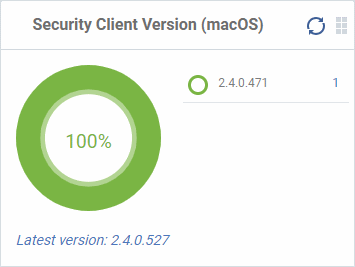
Security Client Version (Mac OS)
See Remotely Install Packages on Mac OS Devices for more details. |
|
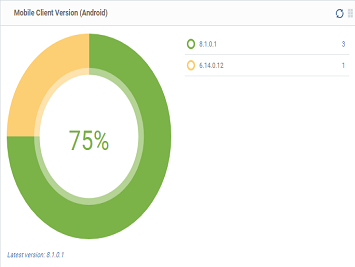
Mobile Client Version (Android)
|
 |
|
|
Device Types
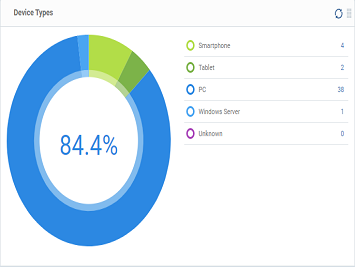
Shows the composition of your device fleet by device type. Place your mouse cursor over a sector see further details.
For example, clicking on 'Tablet' in the legend will open the 'Device List' page displaying the list of tablet devices. See Manage Devices for more details. |
|
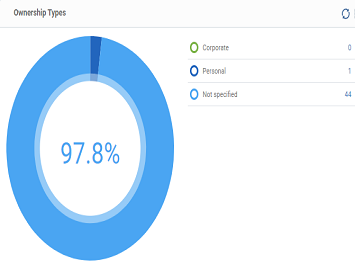
Ownership Types Ownership types can be 'Corporate', 'Personal' or 'Not Specified'.
For example, clicking on 'Personal' in the legend will show all devices in that category. See 'Devices' for more details. Change ownership type:
|
 |
-
Click 'Dashboards' on the top
-
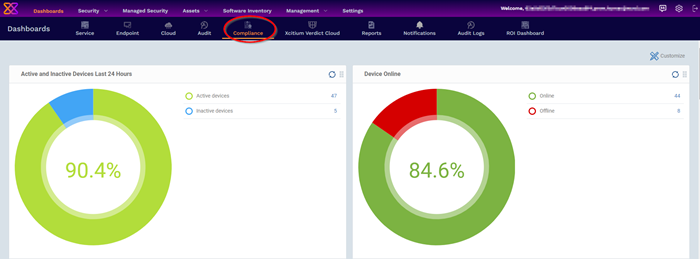
Select the 'Compliance' tab
The compliance dashboard monitors the status of managed devices with regards to various security and activity criteria. Charts shown include, devices with viruses, devices with blacklisted applications, device requiring database updates, rooted and jail-broken devices, devices which are unresponsive and more.
-
Click the 'Customize' button to add or remove the charts shown in the interface
-
Click the 'Refresh' icon at top right of a tile to update the data in it
-
Click and drag the grid icon
 at top right of a tile to change its
location.
The 'Compliance' dashboard shows the following tiles:
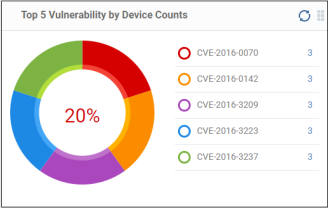
Top 5 Vulnerability by Device Counts
Shows the top five weaknesses detected by Xcitium on the enrolled Windows devices.
-
Place your mouse over a sector or the legend to view further details.
-
Click a vulnerability identifier (CVE code) to view the devices that require the security patch. See Manage OS Patches on Windows Endpoints to know how to deploy the security patch.
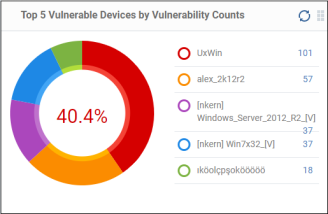
Top 5 Vulnerable Devices by Vulnerability Counts
Shows the top five devices that require security patches.
- Place your mouse over a sector or the legend to view further details.
-
Click a device name to view the details of the required patches. See Manage OS Patches on Windows Endpoints to know how to deploy the security patch.
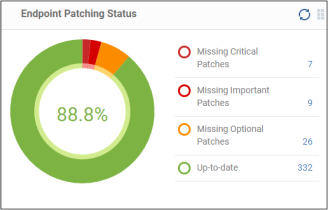
Endpoint Patching Status
Shows the patch statuses on your enrolled devices.
-
Place your mouse cursor over a sector or the legend to view further details. See Patch Management for details about deploying patches.
-
Click an item in the legend to view the respective 'Device List' page.
For example, clicking 'Missing Critical Patches' will open the 'Device Management' page displaying devices that require the critical patches. See 'Manage Devices' for more details.
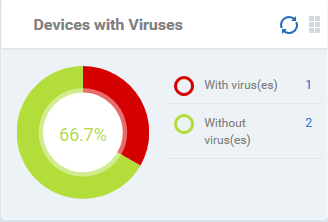
Devices With Viruses
Shows how many enrolled devices are affected by viruses and how many are clean.
-
Place your mouse over a sector or the legend to view further details. See Antivirus Scans for details about scanning for viruses on enrolled devices.
-
Click an item in the legend to view the respective 'Device List' page.
For example, clicking on 'With virus(es)' will open the 'Device List' page displaying devices that contain viruses. See 'Manage Devices' for more details.
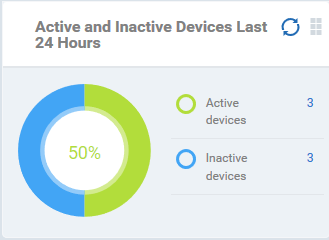
Active and Inactive Devices Last 24 Hours
Shows the connectivity status of enrolled devices. Devices which have not contacted Xcitium for more than 24 hours are marked as 'inactive'.
-
Place your mouse cursor over a sector or the legend to view further details.
-
Click an item in the legend to view the respective 'Device List' page.
For example, clicking on 'Active Devices' will open the 'Device List' page displaying the list of active devices. Similarly clicking on the 'Inactive Device' legend will open the 'Device List' page displaying the list of inactive devices. The devices screens allow you to manage the enrolled devices. See 'Manage Devices' for more details.
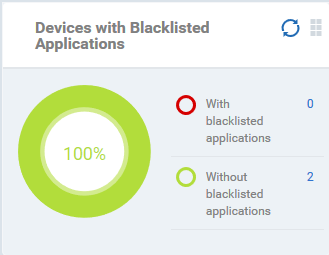
Devices with Blacklisted Applications
Shows how many mobile devices contain blacklisted apps versus those that are free of blacklisted apps.
-
Place your mouse over a sector or the legend to view further details. See Blacklist and Whitelist Applications for details about adding and removing apps from blacklist.
-
Click an item in the legend to view the respective 'Device List' page.
For example, clicking on 'With Blacklisted Applications' legend will open the 'Device List' page displaying the list of devices that have blacklisted applications on them. See 'Manage Devices' for more details.
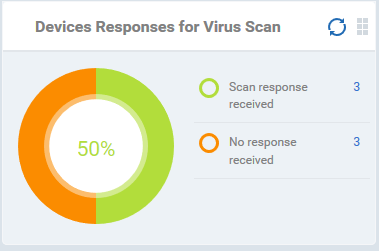
Devices Responses for Virus Scan
Shows how many devices have responded to virus scan requests.
-
Place your mouse cursor over a sector or the legend to view further details. See Antivirus Scans for details about scanning for viruses on enrolled devices.
-
Click an item in the legend to view the respective 'Device List' page.
For example, clicking on 'Scan response received' legend will opens the 'Antivirus' > 'Device List' page showing the list of devices that are responding to scan commands.
The 'Antivirus' > 'Device List' page lets you run antivirus scans on selected devices. See Run Antivirus and/or File Rating Scans on Devices for more help.
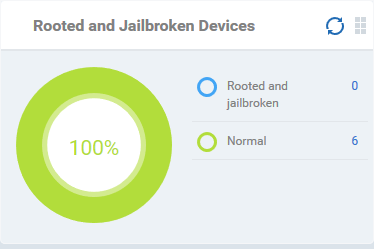
Rooted And Jail-broken Devices
Shows how many devices in your fleet are are rooted or jail-broken.
-
Place your mouse over a sector or the legend to view the further details.
-
Click an item in the legend to view the respective 'Device List' page.
For example, clicking on 'Normal' in the legend will open the 'Device List' page displaying the list of devices that are normal, that is, not rooted or jail-broken. See 'Manage Devices' for more details.
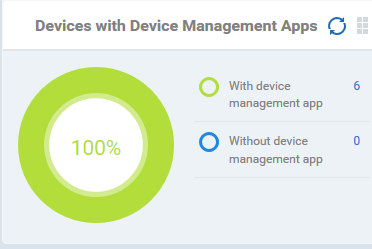
Devices With Device Management Apps
Shows how many devices have the communication client. Android, Windows. Mac OS and Linux devices can only be enrolled with the Xcitium app/communication Client (CC). iOS devices communicate with Xcitium via the Xcitium profile that was installed during enrollment and do not require the app. However, installing the app will provide enhanced functionality such as device location and the ability to send messages to the device from the admin panel.
-
Place your mouse cursor over a sector or the legend to view further details.
-
Click an item in the legend to view the respective 'Device List' page.
For example, clicking on 'With device management App' will open the 'Device List' page displaying the list of devices that have the Xcitium communication client installed. See 'Manage Devices' for more details.
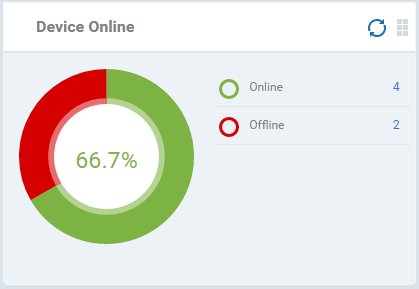
Device Online
Shows enrolled devices by
online/offline status.
Devices are shown as offline if they are turned-off, are not communicating with Xcitium for other reasons, or if Communication Client is not running.
-
Place your mouse over a sector or the legend to view further details.
-
Click an item in the legend to view the respective 'Device List' page.
For example, clicking on 'Online' will open the 'Device List' page displaying the list of devices that are online. See 'Manage Devices' for more details.
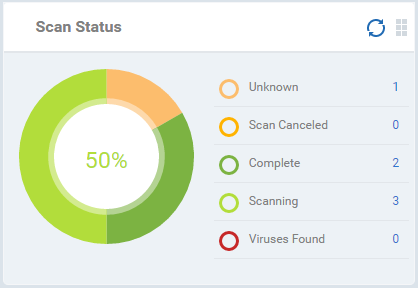
Scan Status
Shows the progress and results of antivirus scans on enrolled devices.
-
Place your mouse over a sector or the legend to view the further details.
-
Click an item in the legend to view the respective 'Device List' page.
For example, clicking on 'Virus Found' in the legend will open the 'Antivirus Device List' page displaying the list of devices in which the malware were detected. See Antivirus and File Rating Scans for more details.
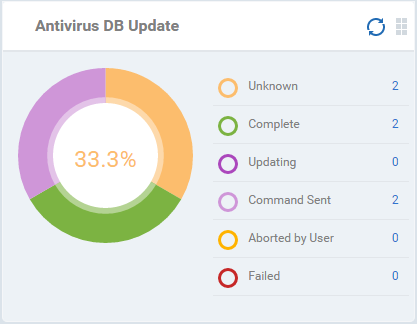
Antivirus DB Update
Shows the progress and results of AV database updates on enrolled devices.
-
Place your mouse cursor over a sector to view extra details.
-
Click an item in the legend to view the respective 'Device List' page.
For example, clicking on 'Complete' in the legend will show devices which have the latest virus database. See Antivirus and File Rating Scans for more details.
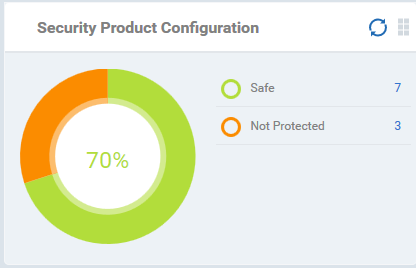
Security Product Configuration
Shows how many of your enrolled devices have 'Safe' or 'Not Protected' statuses. 'Not Protected' means:
-
Xcitium Client Security (XCS) is not installed on the devices
-
XCS is installed but Anti-virus is not enabled in the deployed profiles on the devices
Place your mouse over a sector or a legend to view the details.
-
Click an item in the legend to view the respective 'Device List' page.
For example, clicking on 'Safe' will open the 'Device List' page displaying the list of devices that have Antivirus installed. See 'Manage Devices' for more details.
-
Xcitium Verdict Cloud is a cloud-based file analysis service that tests unknown files with a range of static and behavioral checks in order to identify those that are malicious.
-
To use the service, apply a profile to XCS that contains the 'Verdict' component.
- Click 'Assets' > 'Configuration Templates' > 'Profiles'
- Click the name of the profile you want to edit, or click 'Create' to make a new profile
- Click the 'Add Profile Section' button > 'Verdict'
- Click 'Save'
-
All results will be displayed in the Xcitium Verdict Cloud dashboard. See Xcitium Verdict Cloud in Create Windows Profiles for more details.
|
Note: The version of Xcitium Verdict Cloud that comes with the trial version of Xcitium is limited to the online testing service. The Premium version also includes manual file testing by Xcitium research labs, helping enterprises quickly create definitive whitelists of trusted files. Xcitium Verdict Cloud is also available as a standalone service. Contact your Xcitium account manager for further details. |
Open the Xcitium Verdict Cloud dashboard
-
Click 'Dashboards' on the top
-
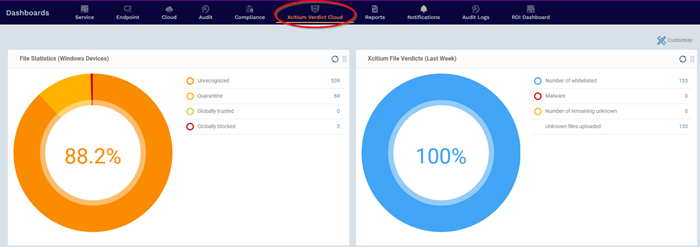
Select the 'Xcitium Verdict Cloud' tab
-
Click the 'Customize' button to add or remove the charts shown in the interface
-
Click the 'Refresh' icon at top right of a tile to update the data in it
-
Click and drag the grid icon at top right of a tile to change its location.
The 'Xcitium Verdict Cloud' dashboard shows the following tiles:
|
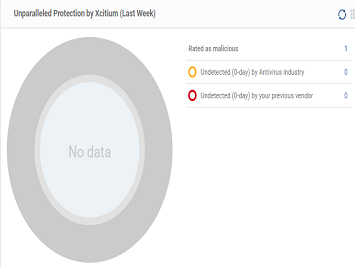
Unparalleled Protection by Xcitium (Last Week) Shows the number of threats identified by Xcitium Verdict Cloud over the past week versus the user's previous vendor and the antivirus industry as a whole. Place the mouse cursor over a sector or the legend to see the percentage of number of files in a particular category. See Manage File Trust Ratings on Windows Devices for more details on Windows File List screen. |
|
|
|
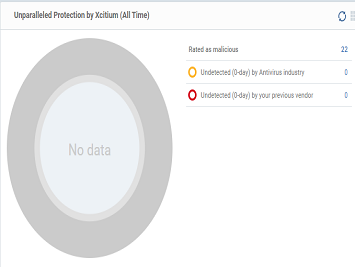
Unparalleled Protection By Xcitium (All Time) Shows the number of threats identified by Xcitium Verdict Cloud since installation versus the user's previous vendor and the antivirus industry as a whole. Place the mouse cursor over a sector or the legend to see the percentage of number of files in a particular category. See Manage File Trust Ratings on Windows Devices for more details on Windows File List screen. |
|
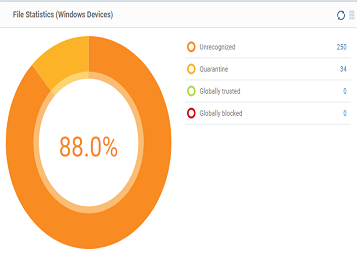
File Statistics (Windows Devices) Shows the trust rating and status of files on your network. See Manage File Trust Ratings on Windows Devices for more details on Windows File List screen
For example, clicking on 'Unrecognized' will open the 'Application Control' > 'Unrecognized' page displaying the list of unrecognized files detected from enrolled devices. See Manage File Trust Ratings on Windows Devices for more details. |
|
|
|
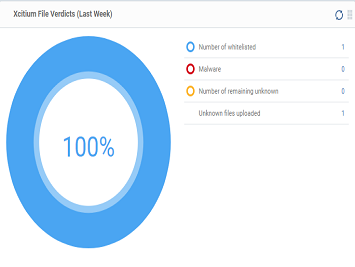
Xcitium File Verdicts (Last Week) Displays Xcitium Verdict Cloud trust verdicts on unknown files for the previous 7 days. This includes the number of unknown files identified as malicious, those that remain unknown, and those that were white-listed (trusted). The total amount of unknown files analyzed is shown at the bottom. Place your mouse cursor over a sector or the legend to view the percentage of files in that category. See Manage File Trust Ratings on Windows Devices for more details on Windows File List screen. |
|
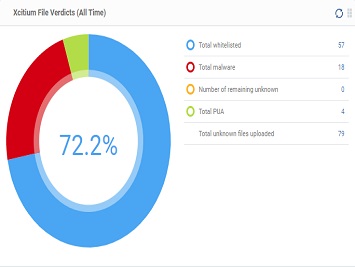
Xcitium File Verdicts (All Time) Displays Xcitium Verdict Cloud trust verdicts on unknown files for the lifetime of your account. This includes the number of unknown files identified as malicious, those that remain unknown, and those that were white-listed (trusted). The total amount of unknown files analyzed is shown at the bottom. Place your mouse cursor over a sector or the legend to view the percentage of files in that category. See Manage File Trust Ratings on Windows Devices for more details on Windows File List screen. |
|
Xcitium can create a wide variety of reports on system and malware activity on your fleet of devices.
-
Click 'Dashboards' at the top
-
Select the 'Reports' tab
-
The reports interface lets you generate and download many different report types:

|
Column Header |
Description |
|---|---|
|
Name |
The subject of the report.
|
|
Type |
The file format of the report. |
|
Status |
Whether or not the report has been downloaded by any user. |
|
Created By |
The admin who generated the report.
|
|
Created At |
The date and time the report was generated |
-
Click any column header to sort items in ascending/descending order of items in that column.
-
Click the funnel icon at top-right to filter and search reports
You can generate reports from the reports interface or from individual product areas:
-
'Dashboards' > 'Dashboards' > 'Reports' interface - Lets you generate following report types:
-
Android Antivirus
-
Android MDM
-
Windows Antivirus
-
Windows Malware List
-
Windows Top Malware
-
Windows Quarantine
-
Hardware Inventory
These reports are generated in spreadsheet (.xls) file format.
-
From specific interfaces:
-
User Management menu
-
User List - Click 'Assets' > 'User Management' > 'User List' > 'Export'. Click here for more details.
-
User Groups - Click 'Assets' > 'User Management' > 'User Groups' > 'Export'. Click here for more details.
-
Roles - Click 'Assets' > 'Users' > 'Role Management' > 'Roles' > 'Export'. Click here for more details.
-
Users - Click 'Assets' > 'Users' > 'Role Management' > 'Users' > 'Export'. Click here for more details.
-
Devices menu
-
Device List - Click 'Assets' > 'Devices' > 'Device List' > 'Export'. Click here for more details.
-
Device Details > File List - Click 'Devices' > 'Device List' > Any Windows Device > 'File List' > 'Export'. Click here for more details.
-
Profiles - Click 'Assets' > 'Configuration Templates' > 'Profiles' > 'Profiles' > 'Export'. Click here for more details.
-
Default Profiles - Click 'Assets' > 'Configuration Templates' > 'Profiles' > 'Default Profiles' > 'Export'. Click here for more details.
-
Alerts - Click 'Assets' > 'Configuration Templates' > 'Alerts' > 'Export'. Click here for more details.
-
'Procedures' main menu
-
Procedures List - Click 'Assets' > 'Configuration Templates' > 'Procedures' > 'Export'. Click here for more details.
-
Procedure Execution Logs - Click 'Assets' > 'Configuration Templates' > 'Procedures' > 'any script procedure' > 'Execution Log' sub-tab > 'Export'. Click here for more details.
- Network Management menu
- Discoveries – Click 'Assets' > 'Network Management' > 'Discoveries' > 'Export'. Click here for more details.
- Managed Devices List – Click 'Assets' > 'Network Management' > 'Devices' > 'Managed Devices' tab > 'Export'. Click here for more details.
- Discovered Devices List – Click 'Assets' > 'Network Management' > 'Devices' > 'Discovered Devices' tab > 'Export'. Click here for more details.
-
Software Inventory menu
-
Mobile Applications- Click 'Software Inventory' > 'Applications' > 'Mobile Applications' > 'Export'. Click here for more details.
-
Patch Management - Click 'Software Inventory' > 'Applications' > 'Patch Management' > 'Operating System' tab > 'Export'. Click here for more details.
-
Security menu
-
Containment - Click 'Security' > 'Endpoint Security' > 'Containment' > 'Export'. Click here for more details.
-
Application Control - Click 'Security' > 'Endpoint Security' > 'Application Control' > 'Export'. Click here for more details.
-
File Verdicts - Click 'Security' > 'Endpoint Security' > 'File Verdicts' > 'Export'. Click here for more details.
-
Device Control - Click 'Security' > 'Endpoint Security' > 'Device Control' > 'Export'. Click here for more details.
-
Device List - Click 'Security' > 'Endpoint Security' > 'Antivirus' > 'Device List' tab > 'Export'. Click here for more details.
-
Current Malware List - Click 'Security' > 'Endpoint Security' > 'Antivirus' > 'Current Malware List' tab > 'Export'. Click here for more details.
-
Quarantined Files - Click 'Security' > 'Endpoint Security' > 'Quarantined Files' tab > 'Export'. Click here for more details.
-
Android Threat History - Click 'Security' > 'Endpoint Security' > 'Antivirus' > 'Android Threat History' tab > 'Export'. Click here for more details.
-
Autoruns Items- Click 'Security' > 'Endpoint Security' > 'Antivirus' > 'Autoruns Items' tab > 'Export'. Click here for more details.
- Data Loss Prevention - Click 'Security' > 'Endpoint Security' > 'Data Loss Prevention' > 'Quarantined Files' tab > 'Export'. Click here for more details.
- License Management menu
- Licenses - Click 'License Management' > 'License Management' > 'Licenses' tab > 'Export'. Click here for more details
- Customers - Click 'License Management' > 'License Management' > 'Licenses' tab > select a license > 'Details' > 'Customers' tab > 'Export'. Click here for more details
These reports are generated in comma separated values (.csv) format.
Generate a report from the 'Reports' interface
-
Click 'Dashboards'
-
Select the 'Reports' tab
-
Click 'Generate Report' from the top and then click on the report type from the drop-down.

A new report is generated for the selected report type.
Download a report
-
Select the report and click 'Download' to save the report on your admin computer

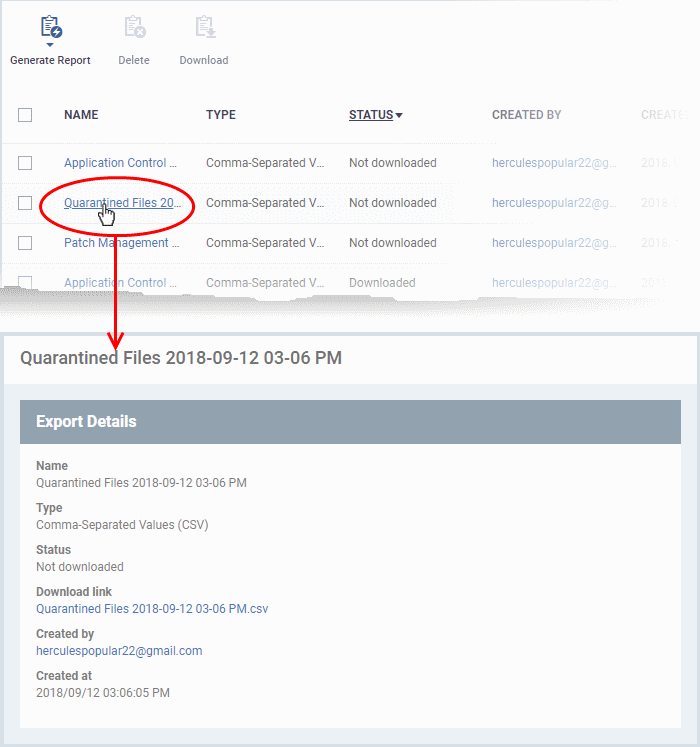
-
To remove a report from the list,select it and click 'Delete'.
-
Click 'Dashboards' on the top
-
Select the 'Notifications' tab
-
The notifications screen shows the list of messages generated for you by Xcitium.

-
Message titles also act as shortcuts to the relevant interface. For example, clicking on 'Malware Found on Windows device' message opens the 'Antivirus Current Malware List' screen.
|
Tip: You can also receive notifications as emails. Click the cog wheel icon at top right and configure notification settings. See Alert Notification Settings if you need help with this. |
-
Click 'Dashboards' at the top
-
Select the 'Audit Logs' tab
-
Xcitium logs actions implemented on managed devices by admins and staff. These logs can be useful when troubleshooting issues.
-
You can forward logs to an external syslog server if required. See Configure Audit Log Settings for more on this.
-
Example logged actions include:
- Add or remove devices
- Apply a security profile
- Create or edit a profile
- Package installations
- Remote take-over sessions
- Changes to containment settings
- Remote file transfers
- Auto-removal of old / duplicate devices
-
Each log entry is accompanied with details such as the staff member who applied the action, the affected device, the action taken, and more.
-
Logs are kept for up to one year for PCI-DSS compliance.
-
You can generate a report containing logs for the past three months as a comma separated values (CSV) file.

|
Audit Logs - Column Descriptions |
|
|---|---|
|
Column Heading |
Description |
|
Staff |
Username of the admin or staff member who executed the action.
|
|
Event Name |
The action executed on the device. Examples include enrollment of devices, remote installation of Xcitium and third party MSI packages, remote take-overs and device removals. |
|
Affected Object |
The device, device group, profile, procedure or file group on which the action was executed.
|
|
Old Value |
The previous setting or value before the action
was implemented. |
|
New Value |
The new setting or value after the action was
implemented. |
|
Extra Info |
Additional details about the action. Additional details include devices on which the procedure was run, package installation parameters, profiles applied/removed, malware quarantined, antivirus scans run and so on.
|
|
Session ID |
String used to identify the connection session between the device and the Xcitium server during the action. |
|
Log Creation Date |
Date and time of the event. |
|
Controls |
|
|
Export |
Generate a comma separated values (CSV) file of logs for a selected time period. The exported .csv is available in 'Dashboard' > 'Reports' See Generate Audit Logs Reports for more details. |
-
Click the 'Refresh' icon to load the latest events.
Search and filter options
-
Click any column header (except 'Event Name') to sort items in alphabetical order of items in that column
-
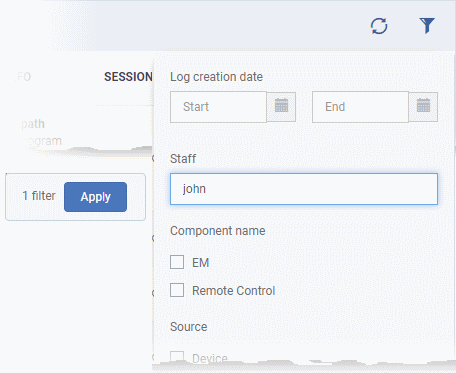
To filter or search for a specific event, click the funnel icon
 at the
top right.
-
You can filter items by various criteria or search for specific events.
-
Click 'Apply' to run your filter.
-
Click 'Dashboard' > 'Audit Logs'.
-
Click the funnel icon
 to filter which records are included in the report.
-
Click 'Export' above the table then choose 'Export to CSV'. You can export logs for up to the past 90 days (Day 1 - Day 90).
-
The CSV file will be available in 'Dashboard' > 'Reports'
-
See Reports for more details.


