CNAPP Dashboard
With CNAPP Dashboard, Xcitium provides you a comprehensive view of the security posture from cloud native applications to the infrastructure where its hosted. We cover application or infrastructure inventory to have the visibility, Threat Intelligence using Vulnerability/Findings by Severity, Compliance Monitoring against standard frameworks (technical or legal), Risk Assessment with respect to Image/Repo scan and security issues, workloads exposed to Internet, critical Runtime Events and policies assessment and Remediations to track for fixing/patching solution to known issues.
- Click 'Dashboards' on the top
- Click 'Cloud' tab
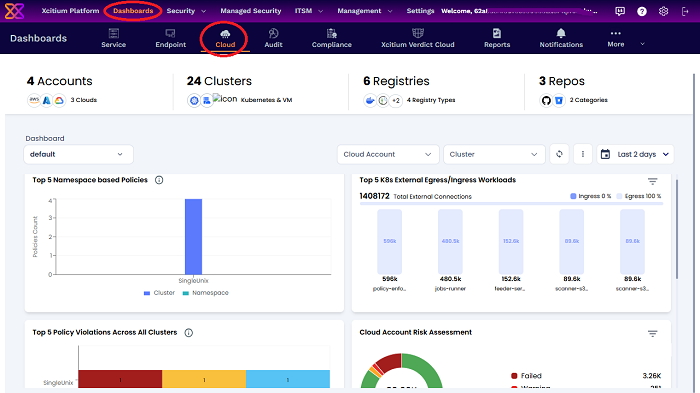
The dashboard shows the following charts:
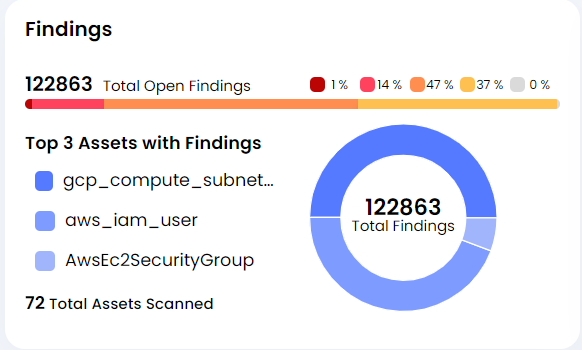
- Findings
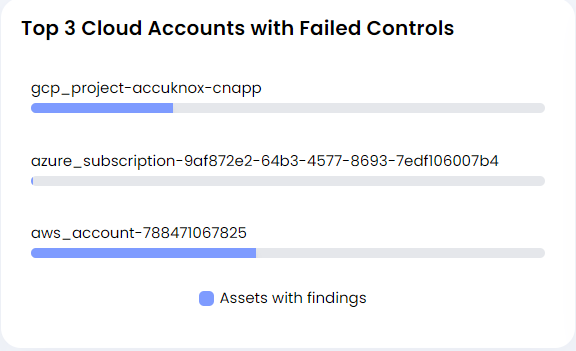
- Top 3 Cloud Accounts with Failed Controls
- Compliance Status
- Image Risk Assessment
- Image Security Issues
- Runtime Policies Assessment
- Top 5 K8s Workloads Exposed to Internet
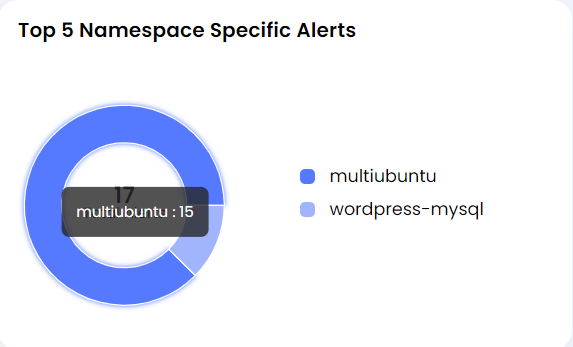
- Top 5 Namespace Specific Alerts
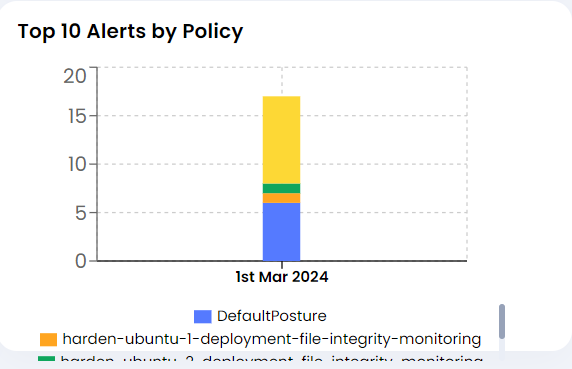
- Top 10 Alerts by Policy
Shows the list of total open findings by tracking of all the actionable items related to findings/vulnerabilities. It will be crucial to maintain a desired SLA a company has decided to comply against by isolating false positives, exception, findings with no fix, duplicate from the Active findings/vulnerabilities.
This data will provide visibility into workload behavior and runtime events over a period of time. It is a net sum of overall alerts generated from all clusters for that tenant.
This graph will inform users of standard compliance framework-related violation alerts. Xcitium helps you to identify violations with respect to technical compliance such as CIS, STIG, etc., and governance compliance such as NIST, MITRE, HIPAA, etc. This widget will give you compliance conformance assessed from all the clusters for that tenant.
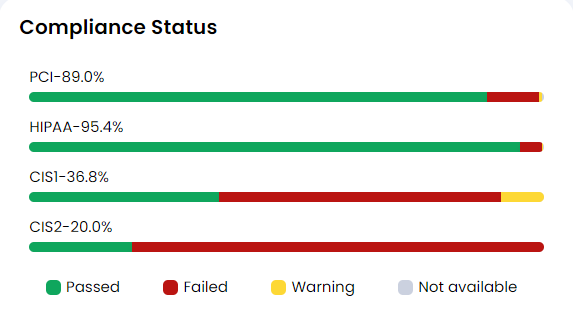
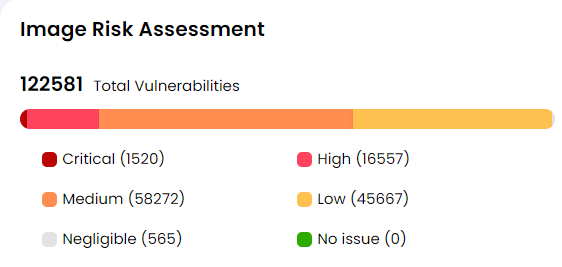
Image Risk Assessment is very crucial widget which show you the count of images by severity per assessment. It will inform you about the status of overall Images security posture and guide you to take necessary steps on the Images with high severity first. The total Images count can be clicked if you want to see the overall status of the
Image scans as it will send your to the Scan Queue in Registry Scan.
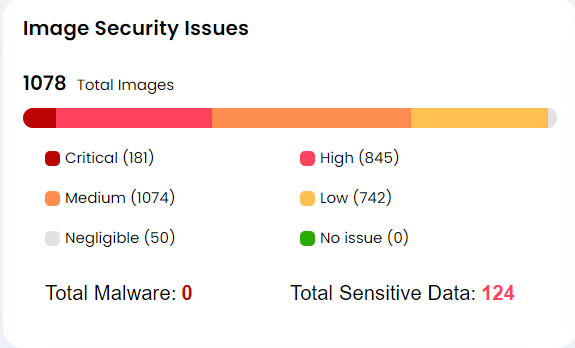
This graph indicates critical to identify issues such as vulnerabilities, malware or sensitive data from the scan assorted by severity to detect early issues in our application security landscape.
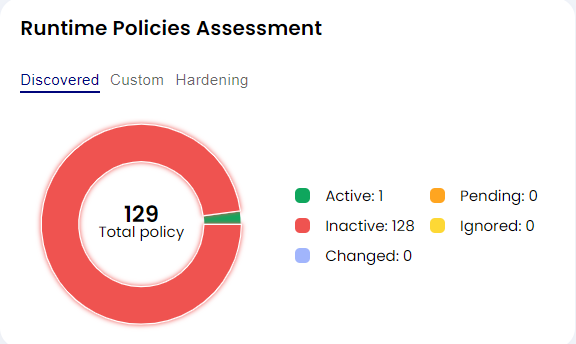
This widget will provide you a view of overall policies status that govern the runtime protection aspect of your application. You should be able to see the following details regarding Policies
- Total Applied Policies across entire organization
- Discovered Policies based on your cluster/environment
- Changed Policies based on detection of config change in the application at runtime
- Active Policies which are actively governing the security posture of your infrastructure
- Pending Policies which are subjected to Admin Approval and could be originated from discovered policies, custom created policies or duplicated altered with minor changes policies
- Inactive Policies which are not governing your application behavior and are inactivated by Admin
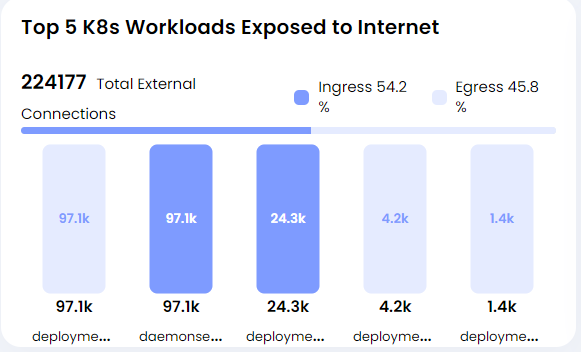
This widget is to solve a concern that is pertinent to many customers where they specifically would want to ensure security coverage from the distinction at the namespace level in a cluster. It will also show namespace specific alerts from all clusters for that tenant. On clicking the widgets title, it will redirect you to the alert screen with appropriate filter.
This graph data will be critical to inform user about any violation in the Policies governing the runtime security of the application over a period of time. It will be helpful to look back on the top events with high severity for user to take action on it, if necessary.
