View and Edit Monitors
-
You can view the details of predefined and custom monitors, but you can only edit custom monitors.
-
You can also view profiles in which a monitor is active, and events generated by the monitor.
View details of a monitor
-
Click 'Assets' > 'Configuration Templates' > 'Monitors'
-
Click the name of a monitor to open its configuration interface
The configuration interface allows you to:
-
Click 'Assets' > 'Configuration Templates' > 'Monitors'.
-
Click on the name of a monitor. The monitor configuration interface will open at the 'General' tab.
-
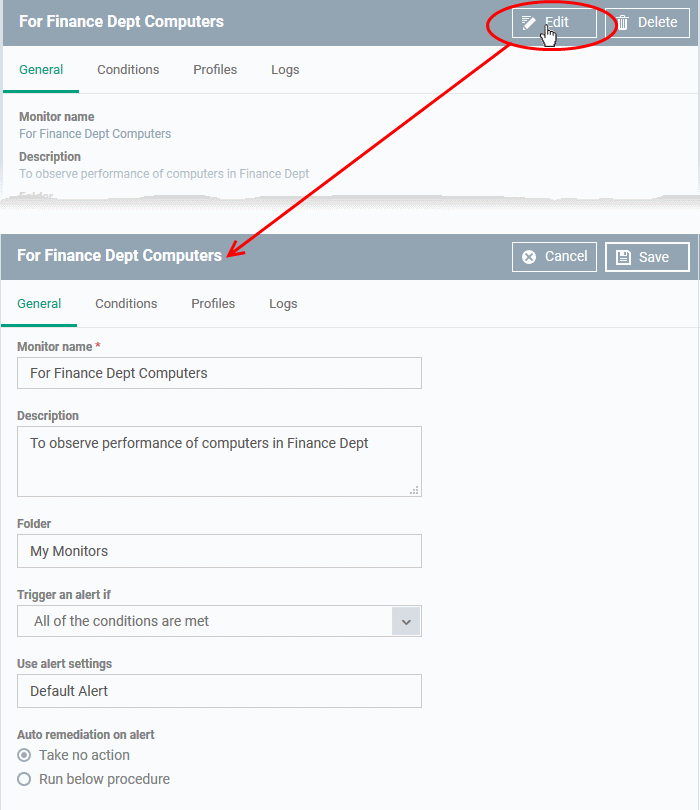
Click the 'Edit' button to modify the details.

General - Modify the name, description, location, alert settings and more
Conditions - Modify the items which are tracked by the monitor
Editing the conditions is similar to adding conditions to a monitor. See Monitors for Windows Devices / Monitors for Mac OS Devices for more details.
Click 'Save' for your changes to take effect.
The changes are immediately implemented in all profiles which use the monitor.
View all profiles which use a particular monitor
-
Click 'Assets' > 'Configuration Templates' > 'Monitors'.
-
Click the name of a monitor to open its configuration interface.
-
Click the 'Profiles' tab.

|
Monitors - Column Descriptions |
|
|---|---|
|
Column Heading |
Description |
|
Profile Name |
The profile in which the monitor is active.
|
|
Owner |
The administrator who created the profile.
|
-
Click 'Assets' > 'Configuration Templates' > 'Monitors'.
-
Click the name of a monitor to open its configuration interface.
-
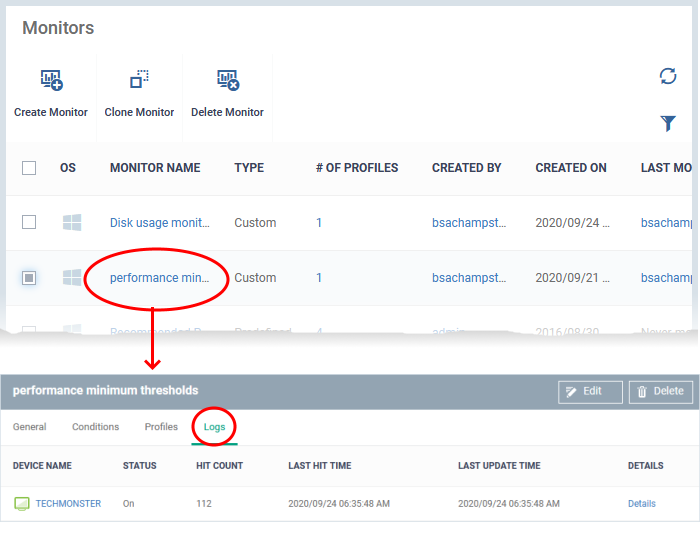
Click the 'Logs' tab.
The 'Logs' tab shows all instances where the conditions of the monitor were breached:

|
Monitoring Logs - Table of Column Descriptions |
|
|---|---|
|
Column Heading |
Description |
|
Device Name |
The Windows or Mac OS device on which the violation occurred.
|
|
Status |
Whether or not the monitor is currently active on the device. |
|
Hit Count |
Number of times the monitored conditions were breached in the last 24 hours. |
|
Last Hit Time |
Date and time the monitoring rule was last broken. |
|
Last Update Time |
Date and time when the information was last refreshed. |
|
Details |
|
-
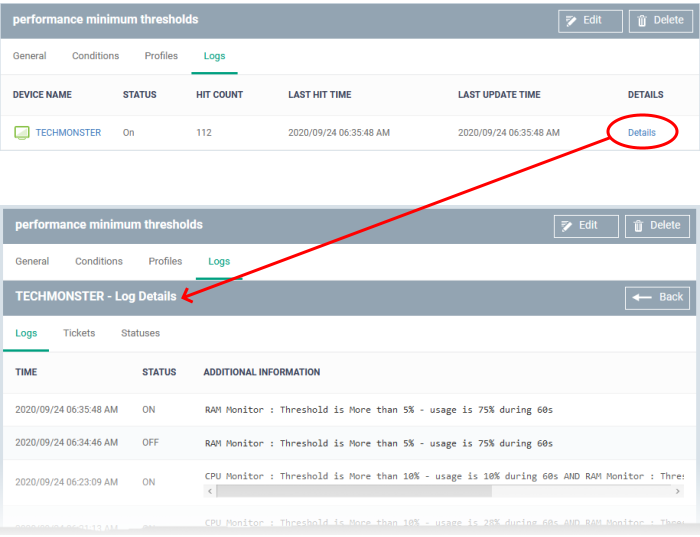
Click the 'Details' link to view the details of the violations of the monitoring conditions:

Logs- The date and time when the event occurred. Also shows the details of the monitoring rule that detected the event.
|
Monitoring Log Details - 'Logs' tab - Table of Column Descriptions |
|
|---|---|
|
Column Heading |
Description |
|
Time |
Date and time of the event. |
|
Status |
The current state of the monitor on the device:
|
|
Additional Information |
Details on the condition monitored and the breach |
Tickets - Applies only to Xcitium products with Service Desk.
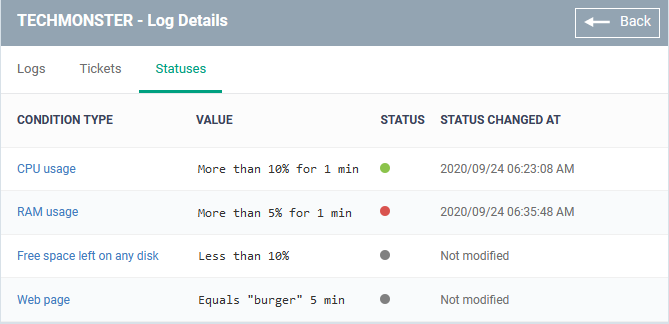
Statuses- Shows the current status of each condition in the monitor:

|
Monitoring Log Details - 'Statuses' tab - Table of Column Descriptions |
|
|---|---|
|
Column Heading |
Description |
|
Condition Type |
The category of monitor. Click the type to view its exact conditions and thresholds. An example is shown below:
|
|
Value |
The thresholds set for the parameter. |
|
Status |
The current state of the monitored parameter on the device.
|
|
Status Changed at |
The date and time of the last change in state of the monitored parameter. |


