Process Timeline
The timeline view of an event shows the hierarchy of processes spawned by the event.
You can view a process on the timeline view from different interfaces. Examples include:
-
'Alerts' > Alert Search' > expand an event or alert > click the value of process hash or child process hash > 'Show in Process Timeline'
-
'Investigate' > Event Search > click the value of process hash or child process hash in the details pane of an event > 'Show in Process Timeline'
The process time line chart of the device opens with the specific process pre-selected. The time line includes the events from 30 minutes before the selected event to 30 minutes after the selected event.
There are two ways you can view the processes spawned:
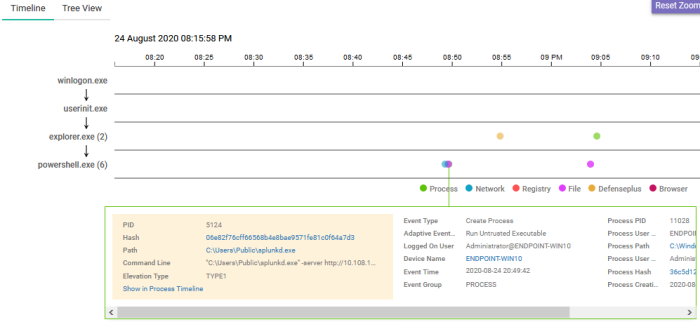
The time line shows the chronological order of events generated by executed process tree..
-
By default, the time line includes the events from 30 minutes before the selected event to 30 minutes after the selected event.
-
The events are color coded for easy identification in the chart. The legend of color codes is given at the bottom of the chart

-
Drag your mouse inside the chart to scroll left or right.
-
Use the scroll wheel in your mouse zoom-in or zoom-out.
-
Click on an event to view its details. The details are shown in the bottom pane. An example is shown above.
-
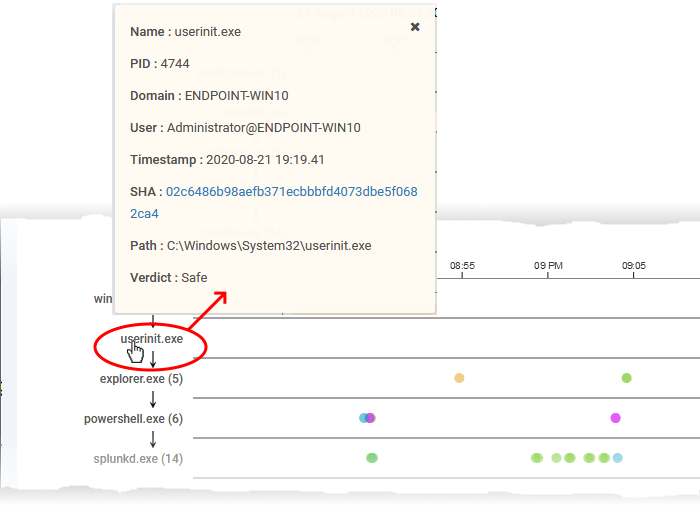
Click on a process to view its details.

-
Click on the hash value of the process to view the events generated by the parent file of the process in all devices in 'Investigate' > 'Hash Search' interface.
-
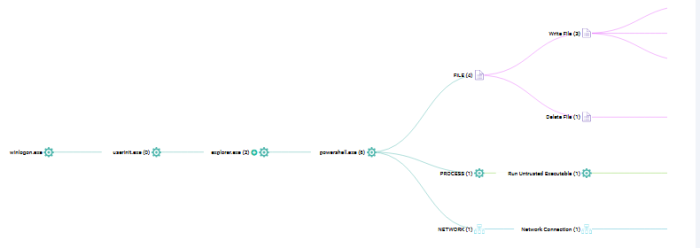
Click the 'Tree view' tab on the top left to view the process hierarchy.

You can view the processes and event types with respective colors.
-
Use mouse to zoom in and zoom out. Click 'Reset Zoom' to default view
-
The number beside a process name indicates the number of events generated by the process.
-
Click a process name to open the 'Event Search' screen with the event search box populated with the selected process parameters.


