View Alerts and Security Events by Time
-
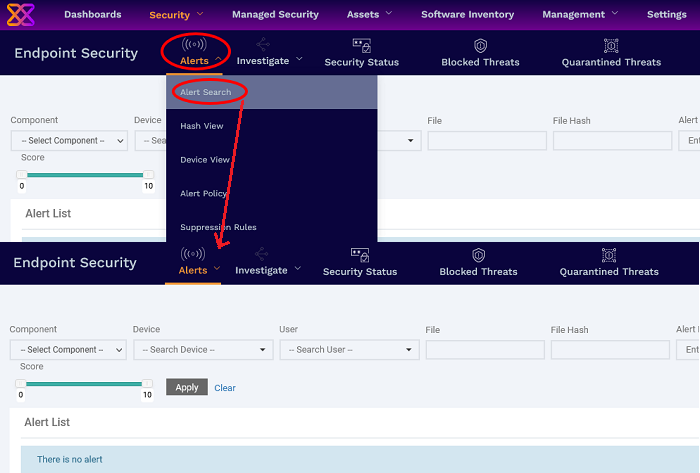
Click 'Security' > 'Endpoint Security' > 'Alerts' > 'Alert Search'
The 'Alert Search' view shows the list of alerts
generated and events logged by various security modules in
chronological order.
You can view search for specific events, view their complete details, investigate events and take actions on the alerts.
Open the 'Alerts Search' interface
-
Click 'Security' > 'Endpoint Security'
-
Place your mouse on the 'Alerts' tab and choose 'Alert Search'
-
The 'Alert Search' view shows security events from all managed endpoints in chronological order:
|
Column Header |
Description |
|---|---|
|
Component |
The module that reported the event. This can be 'Antivirus', 'Containment', 'Application Control', 'Autorun Control', 'Virtual Desktop' or 'EDR'. |
|
Score |
The criticality rating of the event as per EDR rule or the module responsible for the event. Each event is applied a score between 0 and 10 based on its severity.
|
|
The label of the event. This shows how the
file was handled by the component mentioned above or the event
that generated an EDR alert. Here are the possible actions per module: Antivirus - Windows, Mac OS, and Linux devices
Containment - Windows devices
Application Control - Windows devices
Autorun Control - Windows devices
Virtual Desktop - Windows devices
EDR - Windows devices
|
|
|
Alert Time |
The date and time of the event / alert. |
|
Device |
The label of the endpoint on which the event occurred.
|
|
Alert Status |
Progress of the alert generated by the event. Statuses include:
|
The 'Alert Search' view lets you:
The filter fields at the top let
you to search for specific alerts / events using various filter
criteria.

-
Component - Choose the security module that logged the event or generated the alert
-
Device - Choose the managed endpoint on which the event occurred
-
User - Choose the user on whose device the event occurred
-
File - Enter the file name or SHA 1 hash value of the file that generated the event
-
Alert Name - Choose the label of the event. This can describe how the file was handled by a XCS component above or the event that generated an EDR alert.
-
Status - Filter by whether the alert was remediated an closed by an admin or not
-
Score - Use the sliders to set a range of criticality rating to filter alerts
You can use any combination of filters simultaneously to search for specific event.
-
Enter / select the filter and click 'Apply'
-
Click 'Clear' to remove the search filters
-
The 'Alert Search' interface lets you view the granular details of an event including the device on which the event occurred, the security module or the EDR rule that triggered the alert, file / process involved in the event and more.
-
You can investigate the event using the hash values of the process / file involved in it, view the time line and tree views of the processes, view events on all devices by same file and more.
-
You can also take actions like reporting an alert as false-positive, create en exception rule for a file and more
Open the event details
-
Click 'Security' > 'Endpoint Security' > 'Alerts' > 'Alert Search'
-
Use the filter fields to search for specific event
-
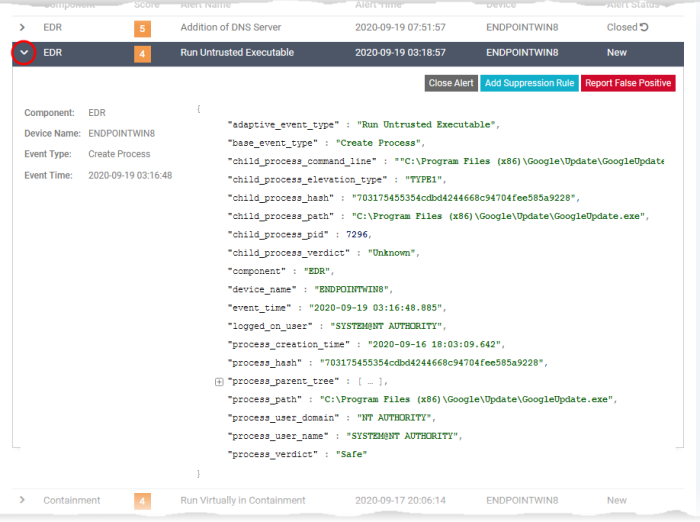
Click the right arrow at the left of an alert / event to expand it
-
The left pane shows the details such as the event name, type, the device on which the event occurred and the time of occurrence.
-
The right pane shows the values of various event parameters. The number of event parameters depends on the event type
The event details screen lets you:
View the process time line of an event
-
Click 'Security' > 'Endpoint Security' > 'Alerts' > 'Alert Search'
-
Use the filter fields to search for specific event
-
Click the right arrow at the left of an alert / event to expand it
-
Click the 'process hash' value and choose 'Show in Process Timeline'

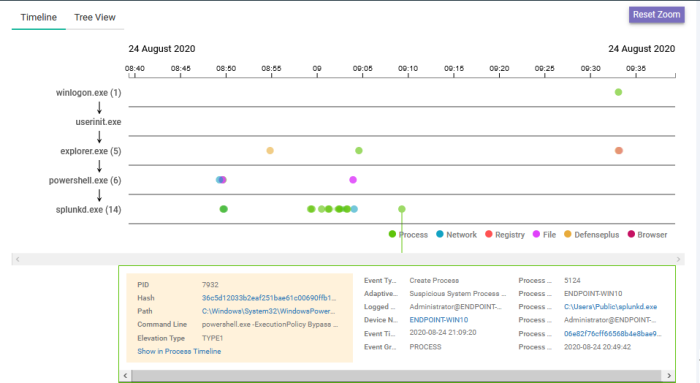
The process time line chart of the
device opens with the event pre-selected. The time line includes the
events from 30 minutes before the selected event to 30 minutes after
the selected event.
The bottom pane shows the details of the event. An example is shown below:
-
Click the 'Tree View' tab at the top to view the hierarchical structure of the processes, involved in the selected event.

See Process Timeline to read more about the time line view.
View details of a process / file using hash search
-
The event details screen lets you to run an hash search for the process or file involved in the event and view its details.
-
The hash search details include basic details of the executable file / parent file of a process, the file trajectory, its execution history and more.
-
You can also view the Valkyrie verdict of the file and set your own admin rating for the file from this interface.
View details of file / process involved in an event
-
Click 'Security' > 'Endpoint Security' > 'Alerts' > 'Alert Search'
-
Use the filter fields to search for specific event
-
Click the right arrow at the left of an alert / event to expand it
-
Click the value in the 'file hash' or 'process hash' field and choose 'Show file in Hash Search'

The 'Security' > 'Endpoint Security' > 'Investigate' > 'Hash Search' screen opens with the details of the chosen file or the parent file of the chosen process and events generated by the file.
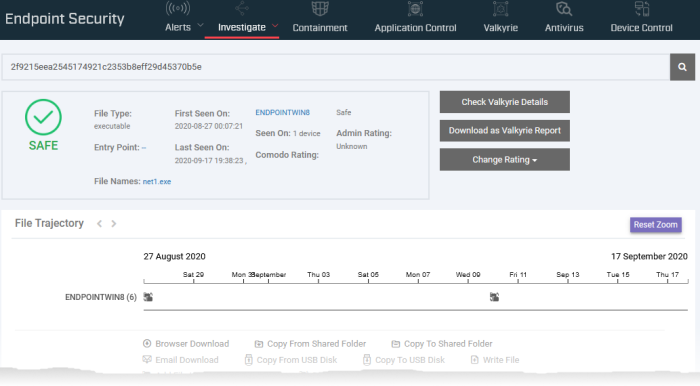
See Search Events by File Hash to read more about the details shown on this page.
Run a search event query with a specific file name or file path
-
The event details screen lets you to create a query with the name or installation path of the file involved in the event
-
This is useful to search for all events involving the same file and investigate them
-
You can further refine the query with other search parameters too.
Create an event search query using the file name from an event
-
Click 'Security' > 'Endpoint Security' > 'Alerts' > 'Alert Search'
-
Use the filter fields to search for specific event
-
Click the right arrow at the left of an alert / event to expand it
-
Click the value in the 'file name' or ''file path' field and choose 'Query File Name' or 'Query File Path'
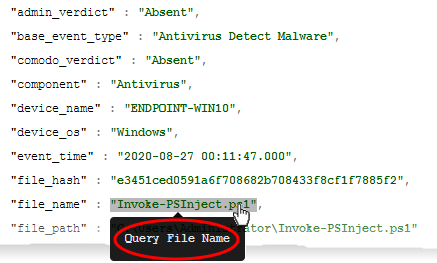
This opens
the 'Investigate' > 'Event Search' interface with the file
name/path pre-populated as search parameter. The interface shows a
list of all events from all devices involving the same file.
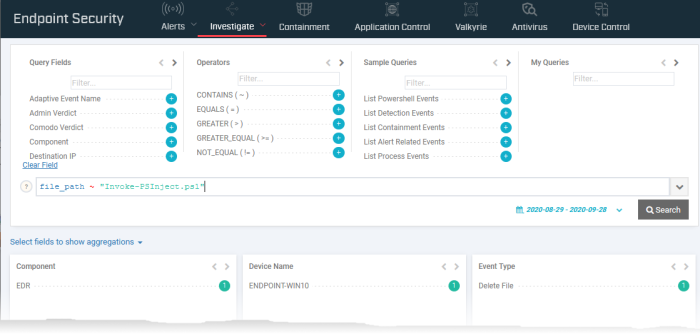
You can refine the search further by adding more search parameters to the query.
See Search Events by Query for help to create search queries for event search.
-
Click 'Security' > 'Endpoint Security' > 'Alerts' > 'Alert Search'
-
Use the filter fields to search for specific event
-
Click the right arrow at the left of an alert / event to expand it
The options on the top right let you take actions on the alert.
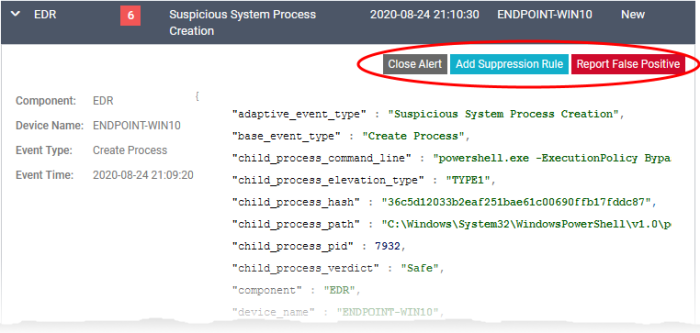
The availability of options depends on the security component that generated the alert or logged the event.
-
Report as False Positive - EDR only. Select this option if you are sure that EDR has generated an alert for a trustworthy file. Your verdict will be sent to Xcitium. We will analyze the file and update the rules accordingly.
-
Add Suppression Rule - EDR only. Select this option if you do not want EDR to generate an alert for the same event in future. The policy rules on your Xcitium Enterprise will automatically update to ignore similar events in future.
-
Close Alert - Select this if you have already taken an action on the rule.
The status of the alert will change to 'Closed' once you choose a verdict for it.


