Search Events by File
Click 'Security' > 'Endpoint Security' > 'Investigate' > 'Hash Search'
-
The 'Hash Search' lets you search for events involving a specific file
-
The search is executed with the SHA1 hash value of the file of interest
-
The interface also shows details about the file. This includes the file trajectory, summaries of execution of a file, creation history, download history and more on various devices
-
In usual practice, the interface can be used for file search from other interfaces like 'Alerts Search', 'Hash view' and 'Device view' under the 'Alerts' menu or 'Investigation' > 'Event Search'
Open the 'Hash Search' interface
-
Click 'Security' > 'Endpoint Security'
-
Move your mouse over 'Investigate' and choose 'Hash search'
.png)
The interface lets you execute a search by pasting the SHA1 hash value of a file, for example, copied from other interfaces of Xcitium. You can also use this interface to view the details and events involved with a file of interest from other interfaces directly. Example include:
-
'Alerts' > 'Alert Search' > expand an event / alert > click on a file hash / process hash value > 'Show File in Hash Search'
-
'Alerts' > 'Hash View' > click on a file hash value
-
'Alerts' > 'Hash View' > 'Alert Actions' in the row of a file > 'File Details'
-
'Investigate' > 'Event Search' > click on a file hash / process hash value in an event result > 'Show File in Hash Search'
The 'Hash Search' interface shows the complete details of a file along with events it generated on various devices.
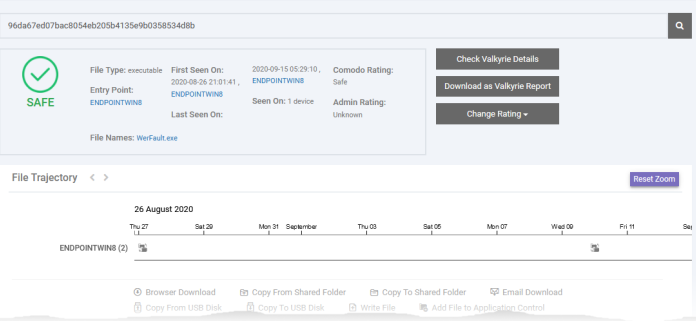
The interface contains following panes:
The top pane shows the details of the file. You can also check the Valkyrie file analysis details and change admin rating of the file.

-
File Type - The nature of file. For example, an executable.
-
Entry Point - The name of the device on which the file was first detected.
Click the device name to view the summary of events detected on that device. This opens the 'Investigate' > 'Device Search' screen with the device pre-selected.
-
File Name - The label of the file.
Click the file name to view the details of events generated by the same file in all devices. This opens the 'Investigate' > 'Event Search' screen with the file name pre-populated as the search criteria.
-
First Seen On - The date and time of an event was first logged by the file and the name of the device on which it was detected.
Click the device name to view the summary of events detected on that device. This opens the 'Investigate' > 'Device Search' screen with the device pre-selected.
-
Last Seen On - The date and time of the most recent event logged by same file and the name of the device on which it was detected.
-
Click the device name to view the summary of events detected on that device. This opens the 'Investigate' > 'Device Search' screen with the device pre-selected.
-
Seen On - The number of devices on which the file was found.
-
Xcitium Rating - The file's trust level as per the Xcitium File Look-up service, reported by the XCS installations at the endpoints. Files are rated as trusted, malicious or unrecognized.
-
Admin Rating - The trust rating of the file as set by the administrator. You can set a rating to the file from this interface too. See Rate Files as Trusted, Malicious or Unrecognized for more details.
-
Detection Time - The date and time the trust verdict was awarded to the file. This may be some time in the past if Valkyrie has already encountered the file and has a database entry for it.
The pane also lets you:
-
Download Valkyrie Report - Get a detailed Valkyrie analysis report for a file as a PDF.
Click 'Download as Valkyrie Report'.
See Get Valkyrie Report of a file for more details.
-
Check Valkyrie Details - View the Valkyrie analysis on a file.
Click 'Check Valkyrie Details'
See View Valkyrie analysis details of file for more details.
-
Rate Files as Trusted, Malicious or Unrecognized - If required, you can rate the files affected by the events as unrecognized, trusted or malicious. Please make sure before marking a file as trusted. Any new file ratings will be sent to endpoints during the next sync.
Click the 'Change Rating' button
Set your preferred rating from the options:
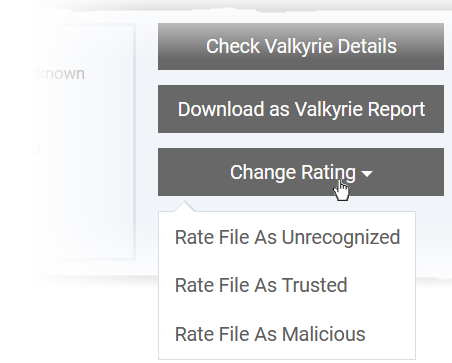
The new rating will be propagated to all endpoints during the next synchronization.
The 'File Trajectory' tile shows
the movement of the file on the endpoints and actions executed on
them.. You can also view the process creation events, alerts
generated and detection events involving the file on the endpoint.

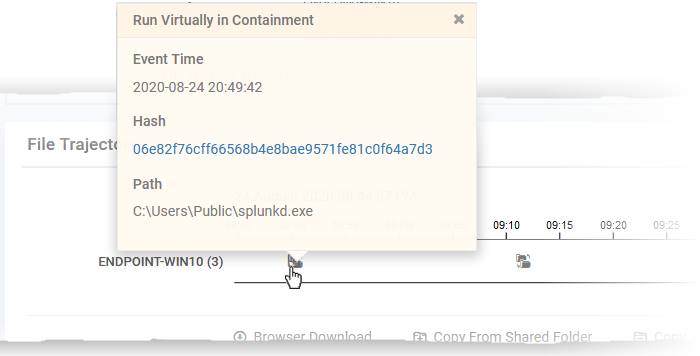
The timeline graph shows the history of the file, with details like how it was downloaded / copied to the device and actions of XCS security components on the device. The legend of the icons used in the graph is shown below the chart.
-
Use your mouse to zoom-in or zoom-out the chart
-
Click on an icon in the chart to view the details of that event
-
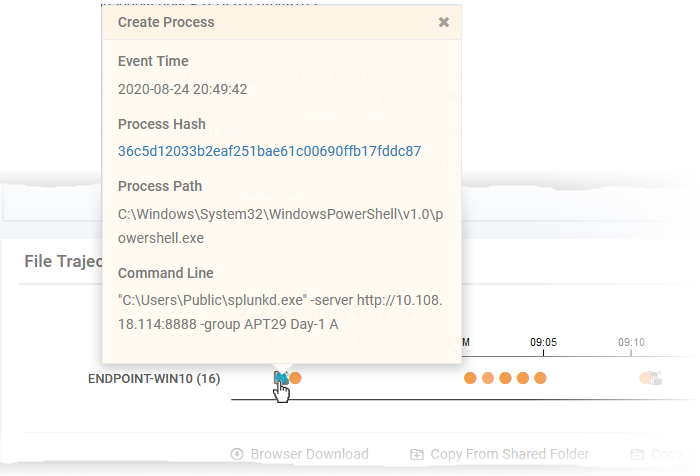
Use the slider switch to view the process creation events, alerts and detection events involved with the file.

-
Click on an event in the chart to view its details
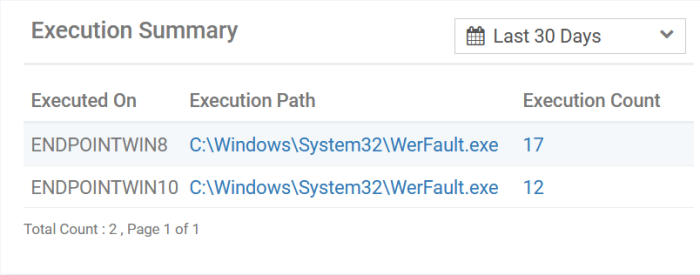
A summary of the devices on which the file was executed. Details include the file path and the number of times it was executed.
-
Use the calendar drop-down at the top right to filter the events by time.
-
Click the execution path or execution count on a device to view the respective execution events. This opens the 'Investigate' > 'Event Search' interface with a query automatically created to view the events. See Search Events by Query for more on details shown on that interface.
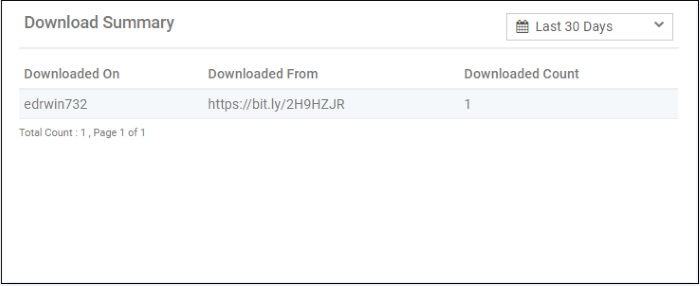
The details of the endpoints on which the file was downloaded (aka 'Entry Point'), the URL from where it was downloaded and the number of times it was downloaded.
-
Select the time-period for which the download summary should be shown. The period ranges from last 15 minutes to 30 days.
-
Downloaded On - The device on which the file was first downloaded
-
Downloaded From - The location from which the file was downloaded
-
Downloaded Count - The number of times the file was downloaded
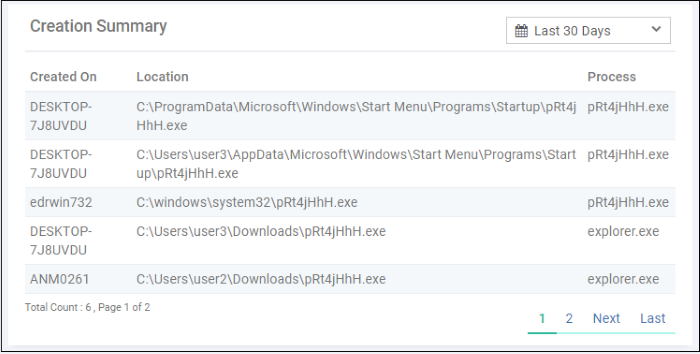
Details of endpoints on which the file has created processes and the location of file from where it was run.
-
Select the time-period for which the creation summary should be shown. The period ranges from last 15 minutes to 30 days.
-
Created On - The device on which the file was run
-
Location - The path of the file from where it was run
-
Process - The name of the application that was run
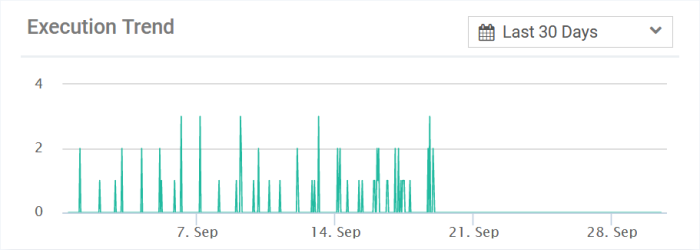
Shows a time line of numbers of times the file was executed at various devices
-
Select the time-period for which the creation summary should be shown. The period ranges from last 15 minutes to 30 days.
-
Place you mouse on a point on the graph to see the number of executions at that time point.
Shows
the devices on which the file was moved to quarantine by the
antivirus module of XCS.
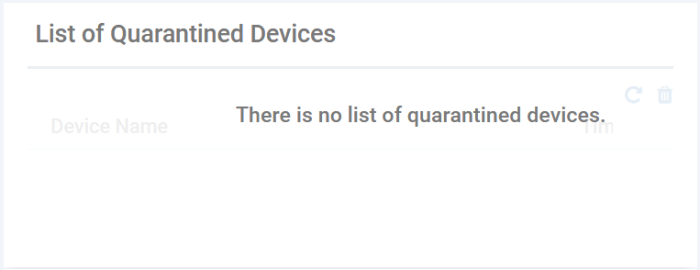
- Device
Name - The label of the device on which the file is moved to
quarantine
-
Time - The date and time at which the file was quarantined
-
You can view and manage quarantined items from the 'Security' > 'Endpoint Security' > 'Antivirus' > 'Quarantined Files' interface.
-
See View and Manage Quarantined Items for more help on this.
List of Autorun Disabled Devices
Shows the devices on which the file was removed from the list of autorun items by the boot protection feature of Xcitium Client Security (XCS).
-
You can view and manage blocked autorun items from the 'Security' > 'Endpoint Security' > 'Antivirus' > 'Autorun Items' interface.
-
See View and Manage Autorun Items for more help on this.
The
numbers of alerts generated by various XCS and Xcitium security
modules for the events generated by the file.
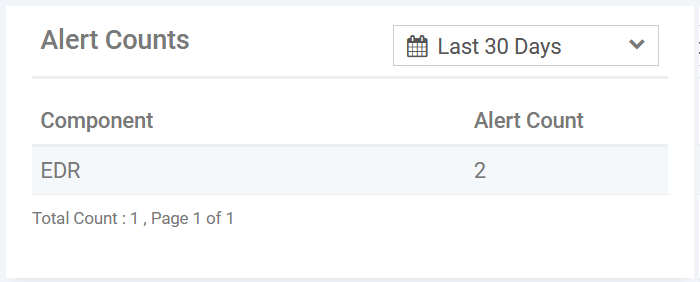
-
Select the time-period for which the creation summary should be shown. The period ranges from last 15 minutes to 30 days.


