Manage Network Monitors
Click 'Assets' > 'Network Management' > 'Monitors'
-
A monitor is a script which tracks events on SNMP devices and takes specific actions if its conditions are met. For example, you can set up a monitor to alert you if a device is switched off for a certain length of time.
-
Network monitors are added to network profiles, which are in-turn applied to your SNMP devices.
-
Click 'Assets' > 'Network Management' > 'Profiles' to view and create network profiles.
-
Click 'Assets' > 'Network Management' > 'Devices' to view discovered SNMP devices.
-
Click 'Assets' > 'Network Management' > 'Discoveries' to create and run scans to find SNMP devices on your network.
-
A single network monitor can be used in multiple network profiles. A single profile can include multiple monitors.
View and manage monitors
-
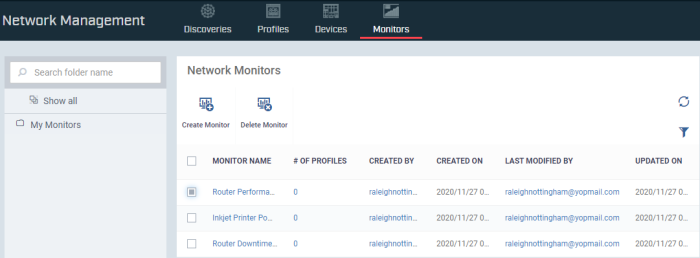
Click 'Assets' > 'Network Management' > 'Monitors'
|
Network Monitors - Column Descriptions |
|
|---|---|
|
Column Heading |
Description |
|
Monitor Name |
The label of the network monitor |
|
No. of Profiles |
Show how many network profiles are using the monitor. Click the number to view a list of the profiles. |
|
Created By |
Admin that added the network monitor |
|
Created On |
Date and time the monitor was added |
|
Last Modified By |
Admin that most recently edited the monitor |
|
Updated On |
Date and time the profile was most recently modified. |
|
Controls |
|
|
Create Monitor |
Configure a new monitor |
|
Delete |
Remove a monitor |
-
Use the funnel on the right to filter monitors by various criteria.
-
Click a column header to sort items by ascending / descending/ alphabetical order
See the following links for more help:
Optional - Create a sub-folder in the My Monitors folder
-
Click 'Assets' > 'Network Management' > 'Monitors'
-
To keep things organized, it is a good idea to create a sub-folder to house your SNMP monitors. You can create individual folders named after your target SNMP devices, or simply create a single folder for all SNMP monitors.
-
Place your mouse on the 'My Monitors' folder and click '+'
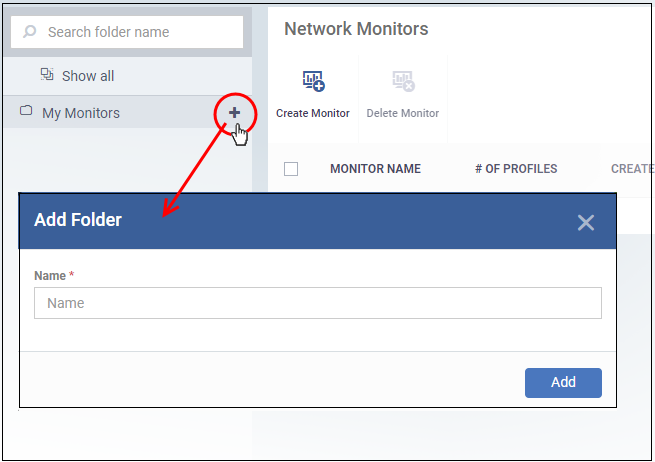
Name - Enter an appropriate label for the sub-folder and click 'Add'
Repeat the process to add more folders as required.
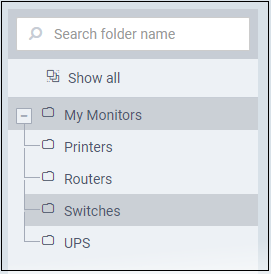
You can also add sub-folders to a sub-folder. You can now save network monitors in your new folders.
-
Rename a sub-folder - Place your mouse over it, click the pencil icon, enter a new name and click 'Save'
-
Delete a sub-folder - Place your mouse over it, click the trash can icon and confirm removal in the delete folder dialog.
-
Click 'Assets' > 'Network Management' > 'Monitors'
-
Select the folder on the left in which you want save the monitor. All monitors are shown in 'My Monitors' irrespective of which you folder save them.
-
Click 'Create Monitor'
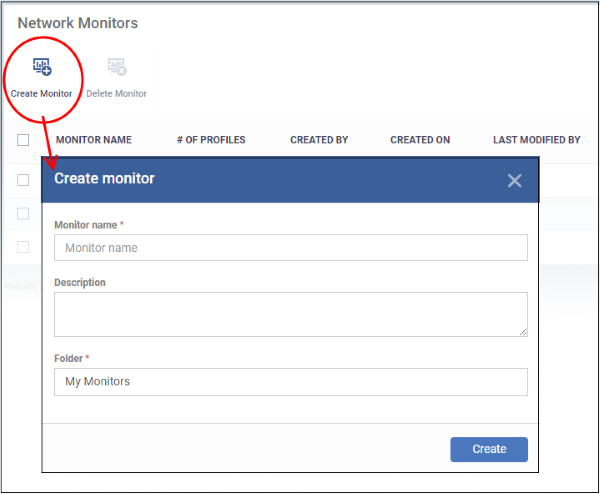
Monitor name - Enter an appropriate label for the monitor, for example, 'Monitor for Switches'
Description - Any short notes about the monitor, if required.
Folder - Select which folder you want to save the monitor. Default is 'My Monitor'. Start typing the folder name and select from the suggestions.
-
Click 'Create'. This opens the monitor, ready for you to configure.
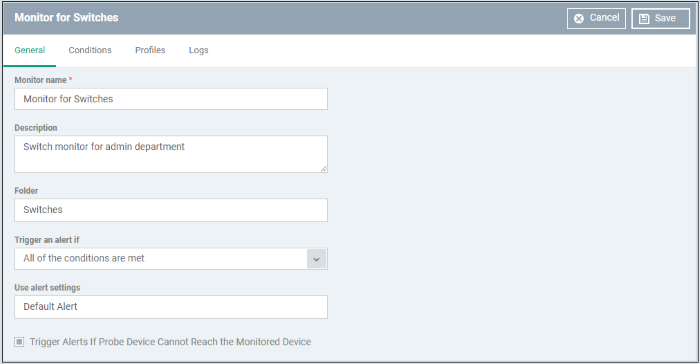
Monitor name, description and folder are what you configured in the previous step. Update if required.
Trigger an alert if - If the conditions that you configure in the 'Conditions' tab is breached, select when alert should be activated. The options are:
All of the conditions are met - All rules that you configure in 'Conditions' tab is met.
Any of the conditions are met - Any of the rules that you configure is met.
Use alert settings - Select the alert type that should be triggered. See 'Manage Alerts' to configure custom alerts and manage them.
Trigger Alerts if Probe Device Cannot Reach the Monitored Device - Alert is activated if the probe device(s) is not able to establish communication with the SNMP device.
-
Click the 'Conditions' tab. This is where you configure rules for the monitor:

-
Click 'Add Condition' and select the item you want to monitor:
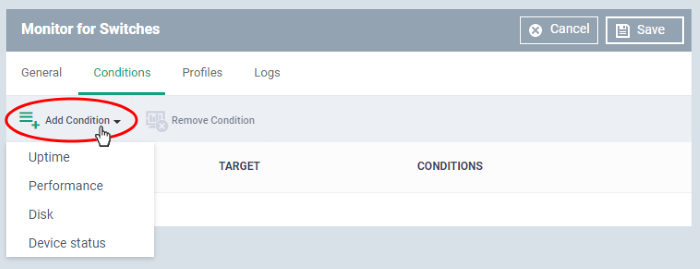
Next, specify the exact conditions of the rule:

-
Click 'Create' to add the rule to the monitor:

-
Repeat the process to add more rules.
-
Click 'Save'. The monitor will be available for selection when create a network profile.
-
Click 'Assets' > 'Network Management' > 'Monitors'
-
Click the monitor name
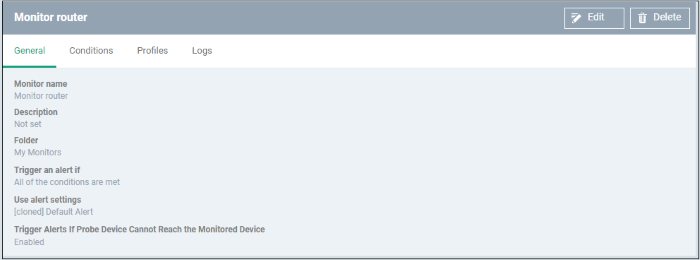
-
Click 'Edit' at top-right
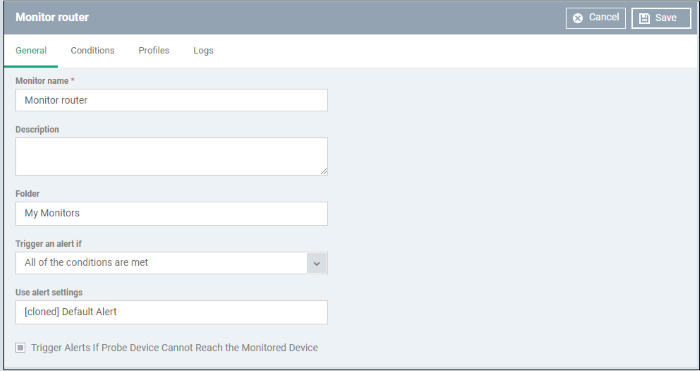
-
The monitor update process is similar to creating a monitor explained above.
-
'Profiles' and 'Logs' screens are populated after the monitor is added to profiles. See 'View Monitor Details'
-
Click 'Save' to apply your changes.
If you delete a monitor, it will be removed from the applicable profiles also.
-
Click 'Assets' > 'Network Management' > 'Monitors'
-
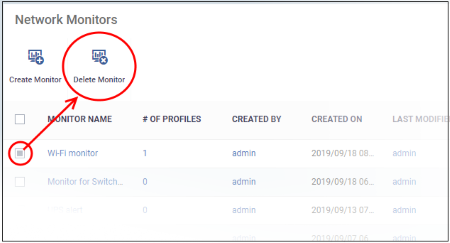
Select the monitor and click 'Delete Monitor'

-
Click 'Confirm'
-
Click 'Assets' > 'Network Management' > 'Monitors'
-
Click the name of a network monitor. The monitor configuration interface opens at the 'General' tab:

The configuration interface lets you to:
Edit a Monitor
-
See Edit Monitor section above.
View all Profiles that use the Monitor
-
Click 'Assets' > 'Network Management' > 'Monitors'
-
Click the name of a network monitor.
-
Click the 'Profiles' tab

|
Network Profile - Table of Column Descriptions |
|
|---|---|
|
Column Heading |
Description |
|
Profile Name |
The profile in which the monitor is active.
|
|
Created By |
The admin that created the profile
|
-
Click 'Assets' > 'Network Management' > 'Monitors'
-
Click the name of a network monitor.
-
Click the 'Logs' tab
The logs tab shows all instances where the conditions of the monitor were breached:

|
Network Monitor Logs - Table of Column Descriptions |
|
|---|---|
|
Column Heading |
Description |
| Device Name
|
The SNMP device on which the breach occurred.
|
|
Status |
Whether or not the monitor is currently active for the device |
|
Hit Count |
Number of times the monitored conditions were breached |
|
Last Hit Time |
Date and time the monitoring rule was last breached |
|
Last Update Time |
Date and time when the information was last refreshed |
|
Details |
|
View Details of Network Monitor Logs
-
Click the 'Details' link to view the details of the breaches of the monitoring conditions:
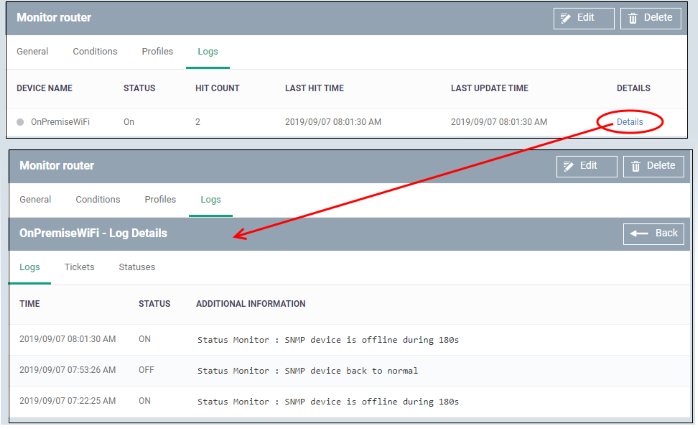
Details are shown under three tabs:
Logs- The date and time when the event occurred. Also shows the details of the monitoring rule that detected the event.
|
Network Monitoring Log Details - 'Logs' tab - Table of Column Descriptions |
|
|---|---|
|
Column Heading |
Description |
|
Time |
Date and time of the event. |
|
Status |
The current state of the monitor on the device:
|
|
Additional Information |
Details on the condition monitored and the breach |
Tickets– Applies only to Xcitium products with Service Desk integrated.
Statuses- Shows the current status of each condition in the monitor:

|
Network Monitoring Log Details - 'Statuses' tab - Table of Column Descriptions |
|
|---|---|
|
Column Heading |
Description |
|
Condition Type |
The category of monitor. Click the type to view its exact conditions and thresholds. An example is shown below:
|
|
Value |
Condition set in the monitor |
|
Status |
The current state of the monitored parameter on the device.
|
|
Status Changed at |
The date and time of the last change in state of the monitored parameter. |


