


View All Assets
All Assets is a collection of all the company's assets. This includes all agents installed and any IP-based assets discovered through network or probe scanning. Assts generally encompass workstations, servers, firewalls, switches, printers, access points, and IoT devices.
- Security < Continuous Threat Exposure Management < 'All Assets'
Access All Assets from the Security - CTEM category. Here, you will see the default view that includes the asset details.
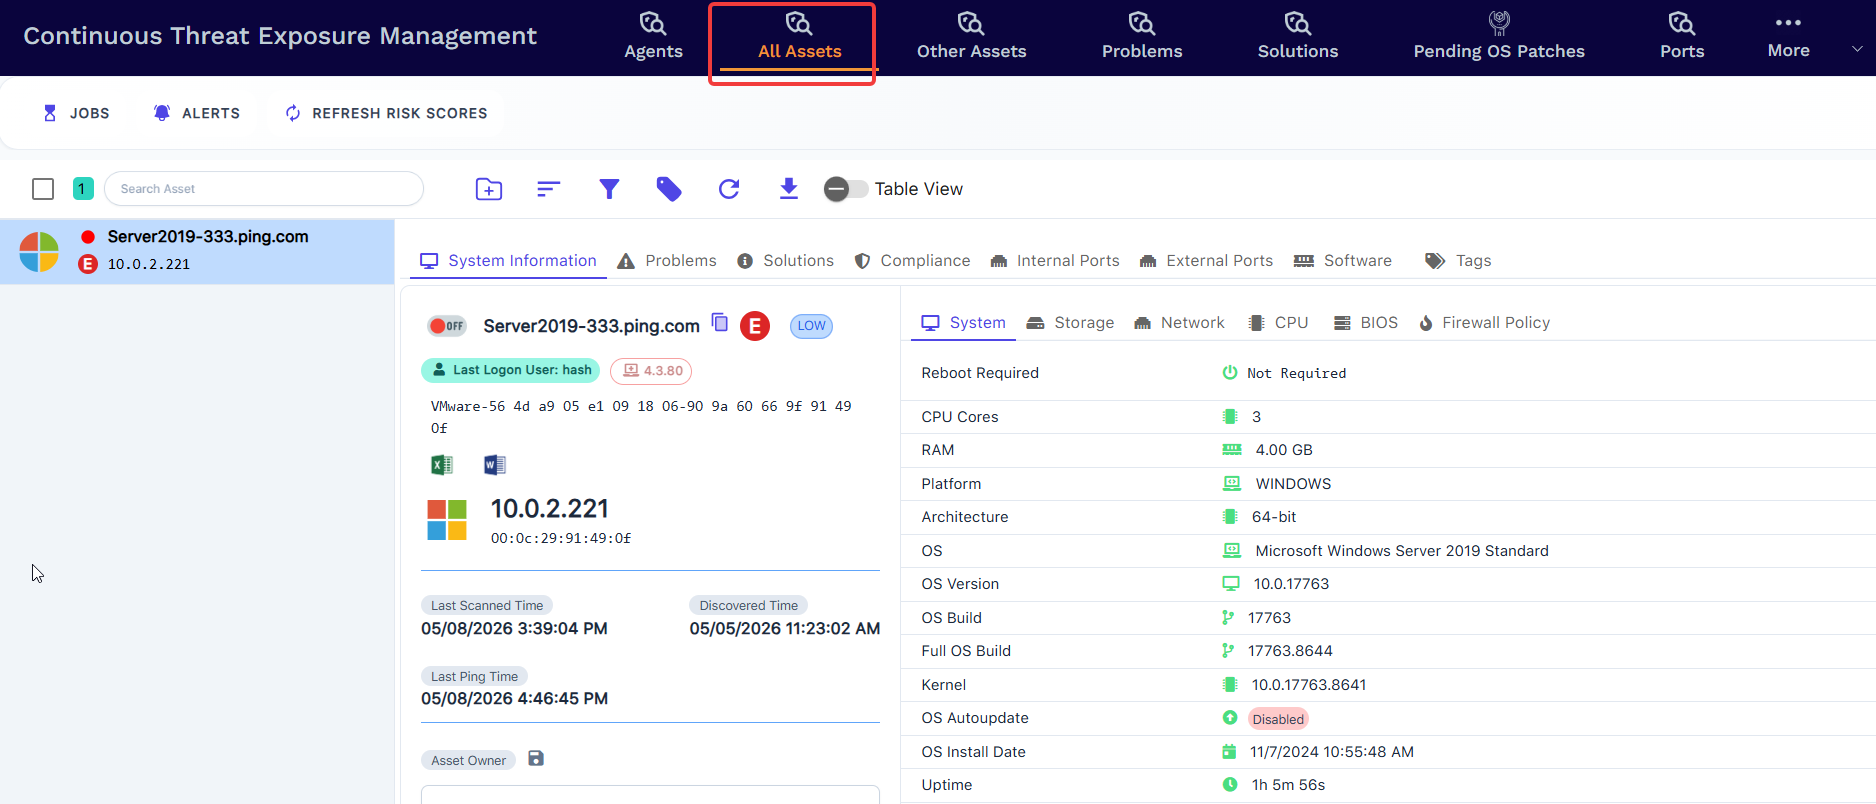
You can access your assets from the multiline table view. You can also easily navigate to asset details via click-through links or use the global search, sort, and filtering options.
Following Action Tool bar options are available:
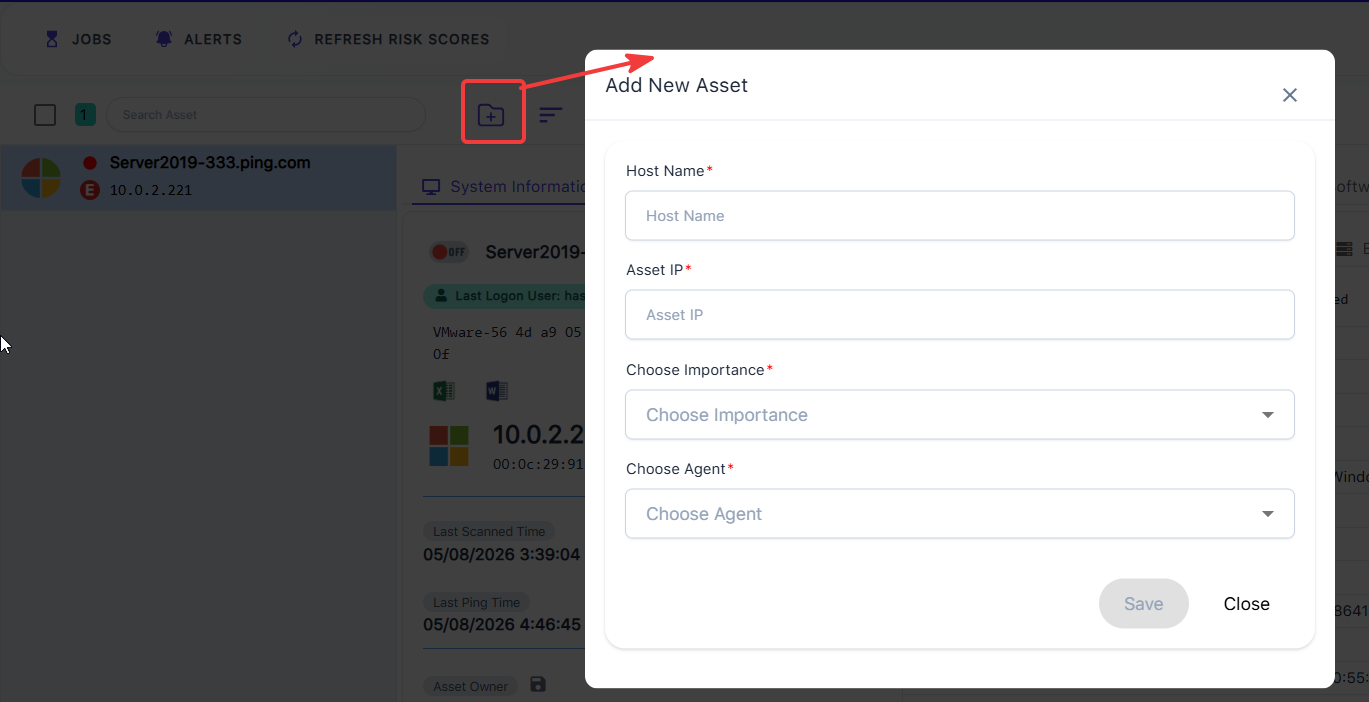
- Add Asset - Tap to add a new Asset manually; this requires a probe agent to be available and associated with the manual asset. The probe will scan the manual asset.
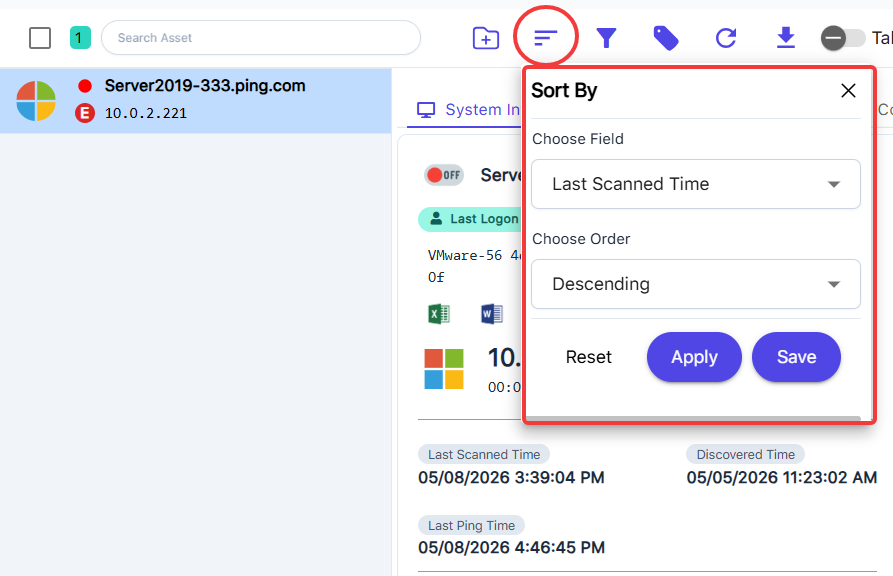
- Sort - Tap the sorting options, including your choice of Fields and Order.
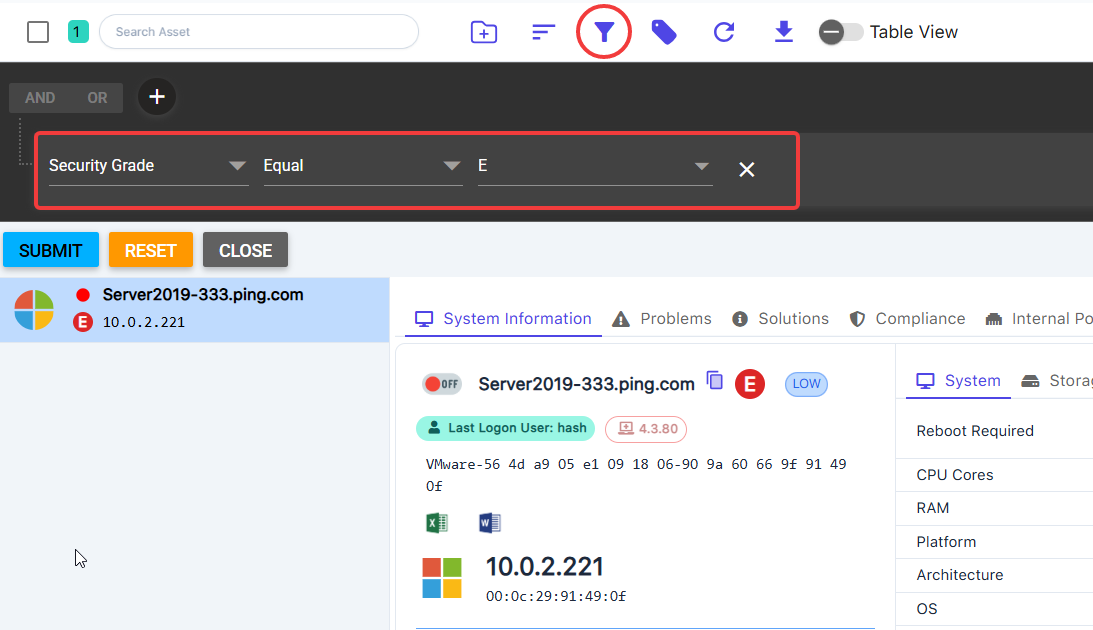
- Filter - Tap to use our built-in field selections to filter the assets.
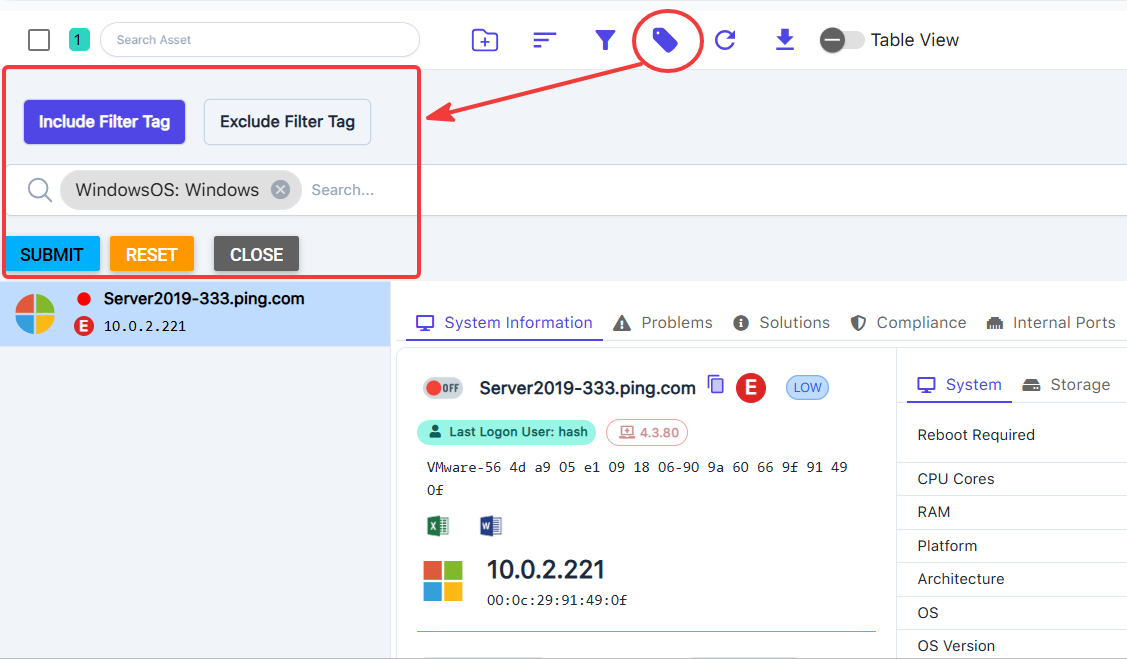
- Filter by Tags - Tap to view the Include Filter Tag and Exclude Filter Tag options:
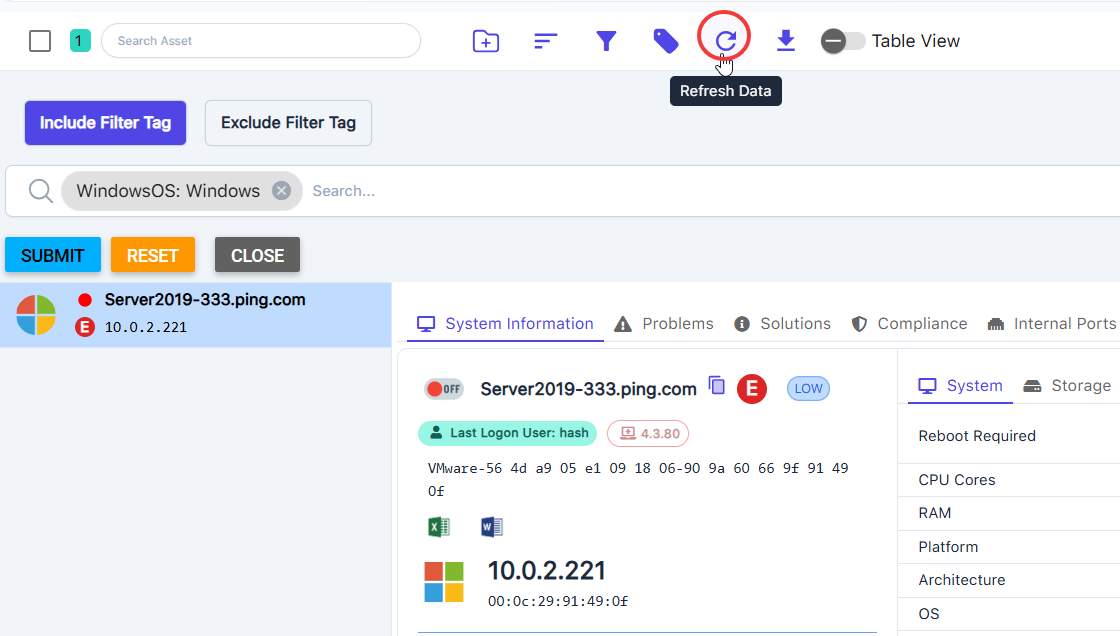
- Refresh - Tap to Refresh the table/asset details:
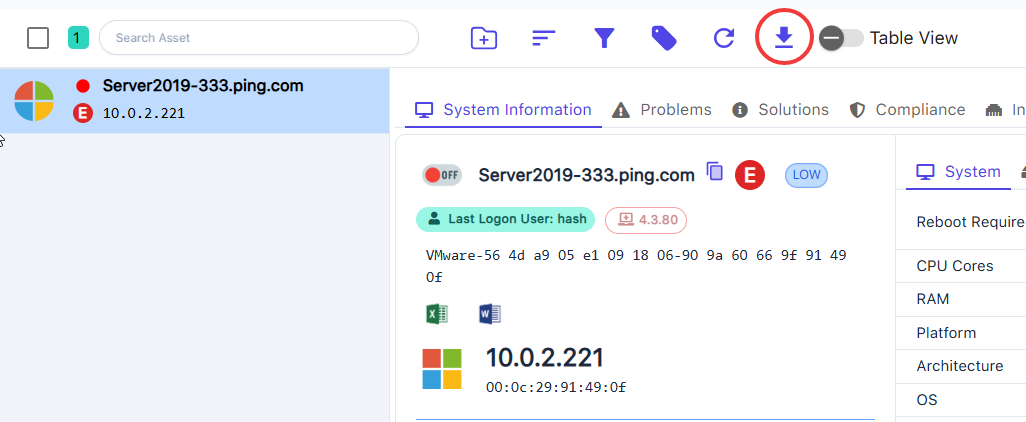
- Download Data - Tap to download the Assets data into CSV.
- Switch Table View - Tap the toggle to use Table View
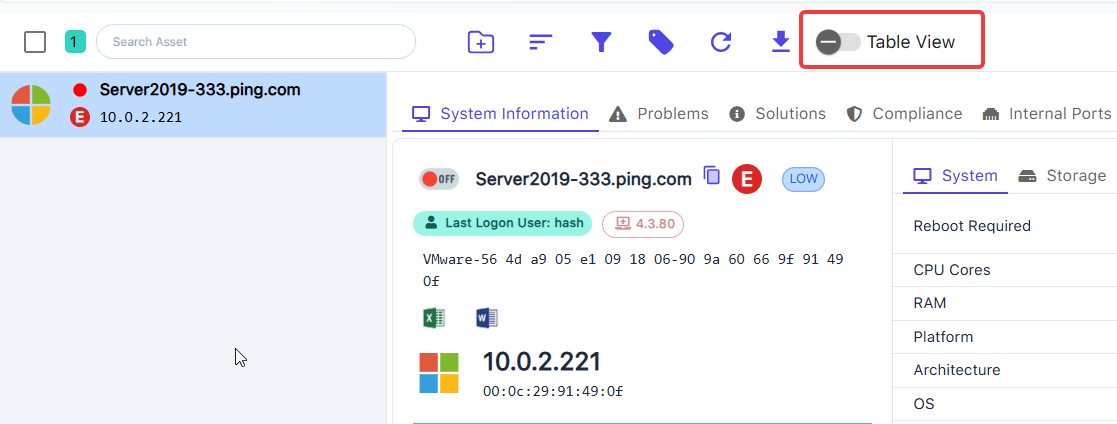
Tap on the X in the top-right corner to exit the table view.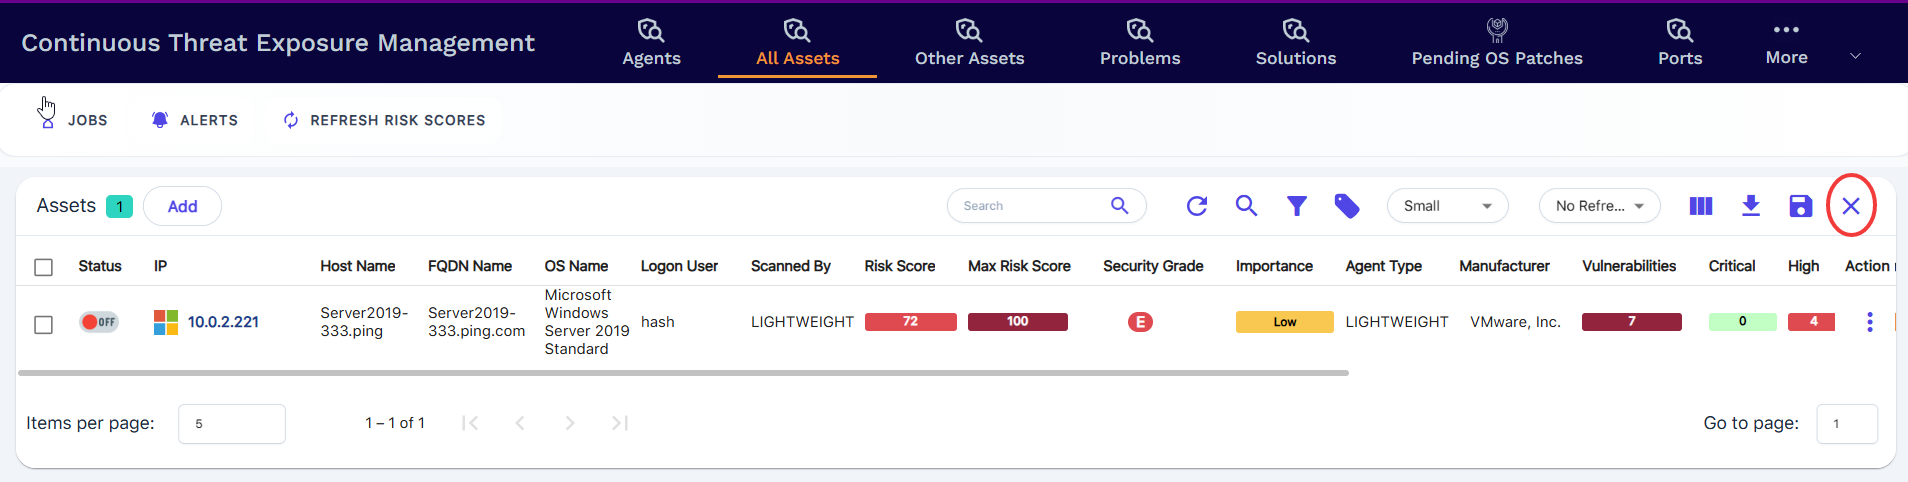
The table view shows critical vulnerability data, security grade, risk score, user information, and more. The column view and reorder options allow you to set and reorder the table view.
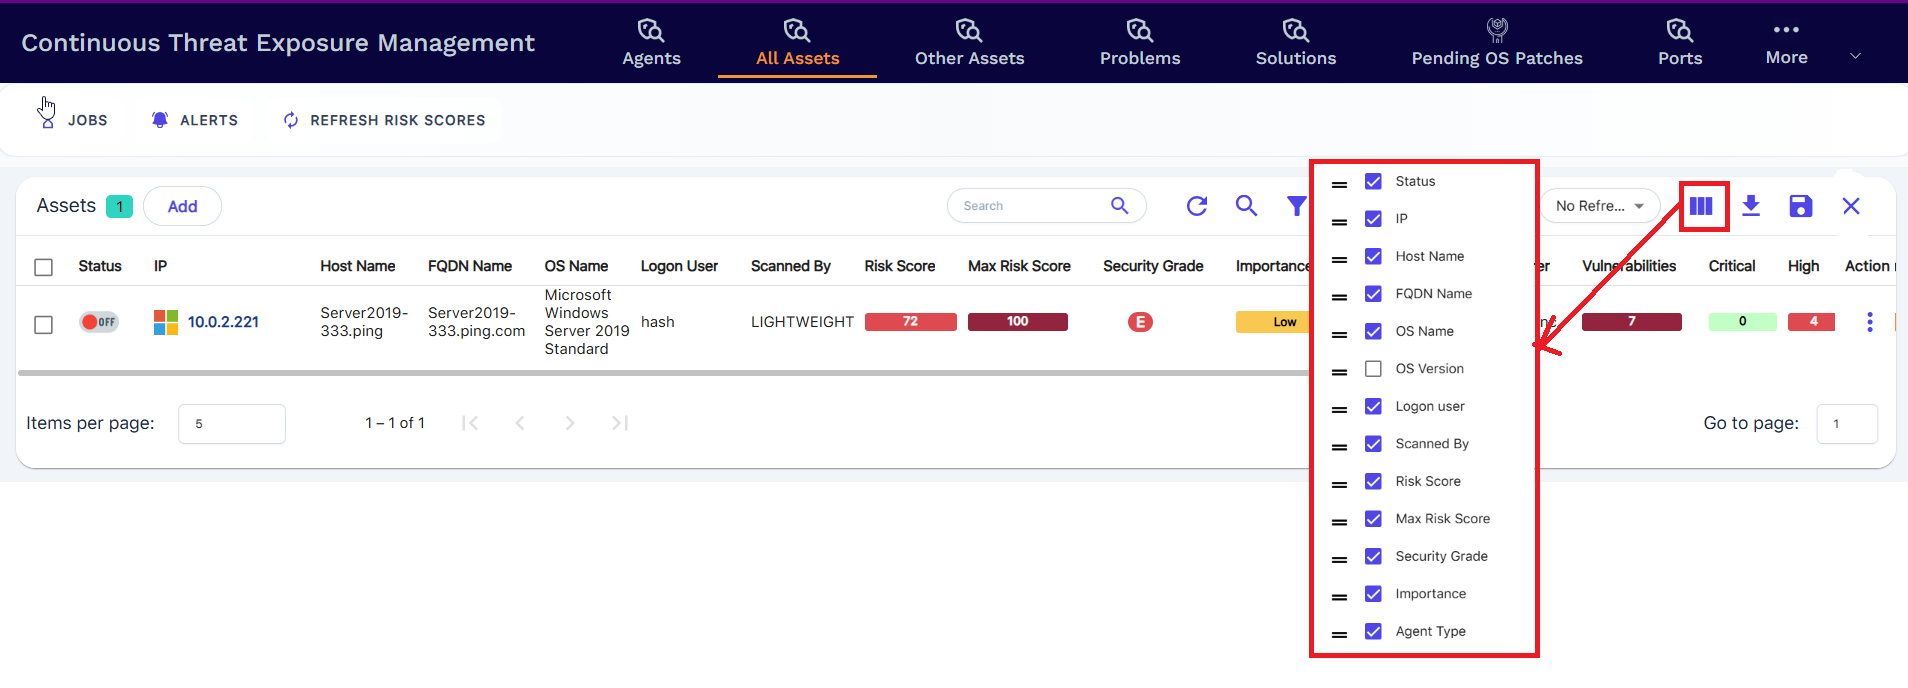
Column data includes the following options:
| Column Label | Description |
| Status | Displays the online status |
| IP | Displays the Asset's IP address |
| Host Name | Displays the hostname |
| FQDN Name | Displays the fully qualified domain name |
| OS Name | Displays the operating system name |
| Logon User | Displays the last login user name (local or domain) |
| Scanned By | Displays which agent scanned the asset. |
| Risk Score |
Displays the Risk Score for the asset; Tap to see the details of the Risk Score calculation.
Risk score statistics are updated every 12 hours, so there may occasionally be a delay in reflecting the most recent changes. You can use the Refresh Risk option in the top tool bar of the Portal to force the update which should reflect with 15 minutes in the Portal
|
| Max Risk Score | Displays the asset's Max Risk Score, which is determined by calculating the highest possible risk score based on the most severe confirmed vulnerability. |
| Security Grade | Displays the security grade A-F where A is good and low-risk. |
| Importance | Displays the selected Importance of the Asset; the user at the asset level defines this; by default, all assets are set to Low unless changed. |
| Agent Type | Displays the agent type as Lightweight or Probe. |
| Manufacturer | Displays the manufacturer. |
| Vulnerabilities | Displays the total count of all discovered vulnerabilities for all categories. |
| Critical | Displays the total count of Critical vulnerabilities. |
| High | Displays the total count of High vulnerabilities. |
| Medium | Displays the total count of Medium vulnerabilities. |
| Low | Displays the total count of Low vulnerabilities. |
| Informational | Displays the count of informational findings that are not classified as vulnerabilities |
| Registry | Displays registry-related findings or configuration data |
| Last Scanned Time | Displays the date/time stamp when the asset was last scanned |
| Domain Status | Displays as WorkGroup for non-domain joined, AzureADJoined, or Domain Name as specified by the OU |
| MAC Address | Displays the MAC address of the asset’s primary network interface. |
| Action | Following options are available - Asset Timeline, Remove Asset, Deprecate Asset, Scan Now, Refresh Risk Score |
Asset details are found in 3 main panels where all the detailed information is found about the asset.
The first pod of information:
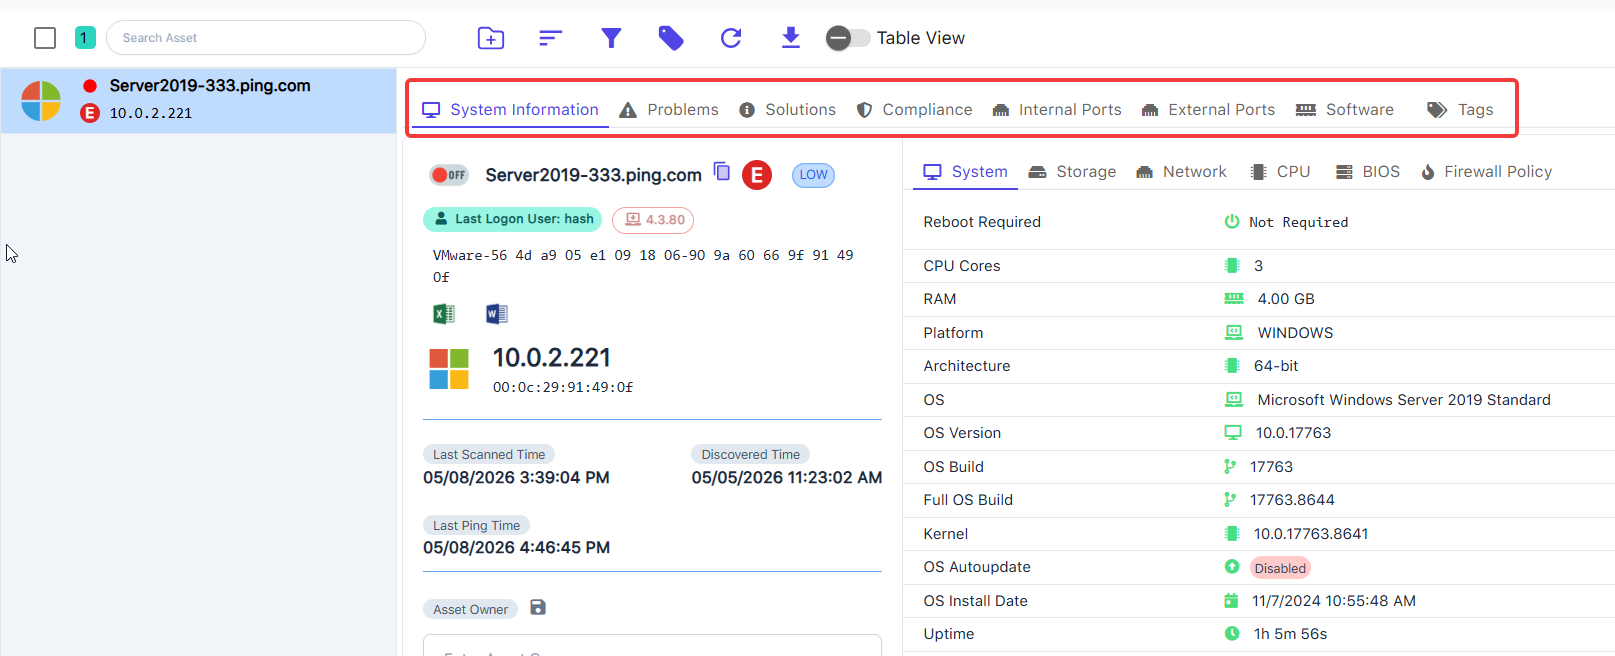
| Tab Name | Description | |||
| System Information | Displays key asset details including device name, agent type, agent version, and unique identifier. Highlights the asset’s current importance level, last logon user, and calculated Risk Score. Also includes IP and MAC address, along with timestamps for last scan, discovery, and ping. An editable field allows assignment of an asset owner. As you continue scrolling down the System Information panel you will also view the following
|
|||
| Problems | Displays the discovered Problems, which are the vulnerabilities and security check/information categories by the Problem Category groups. Tap on the drop-down to toggle between the groups. Displays Registry, Driver Vulnerabilities and Remediation Use the three dot action menu to suppress. At the Company level you will have two options one to suppress or use to the integration action. |
|||
| Solutions | Displays the product-level Remediation Plan action items; these are the solutions to remediate the problems. | |||
| Compliance | Displays results from any Compliance Scan Type(s) enabled for the selected company and asset. Tap between the Compliant, Manual, and Non-Compliant Tabs for more info. |
|||
| Internal Ports | Displays the detected ports with protocol, address, and system info. | |||
| External Ports | Displays the list of externally accessible ports detected by the Probe Agent. This includes port number, service name, protocol, product, status (open/closed/filtered), and associated vulnerabilities. | |||
| Software | Displays the detected installed software from the selected asset. You can see the Uninstall Path, Vulnerability Info, and other details. |
|||
Below that, you will find the next set of pod information that includes:
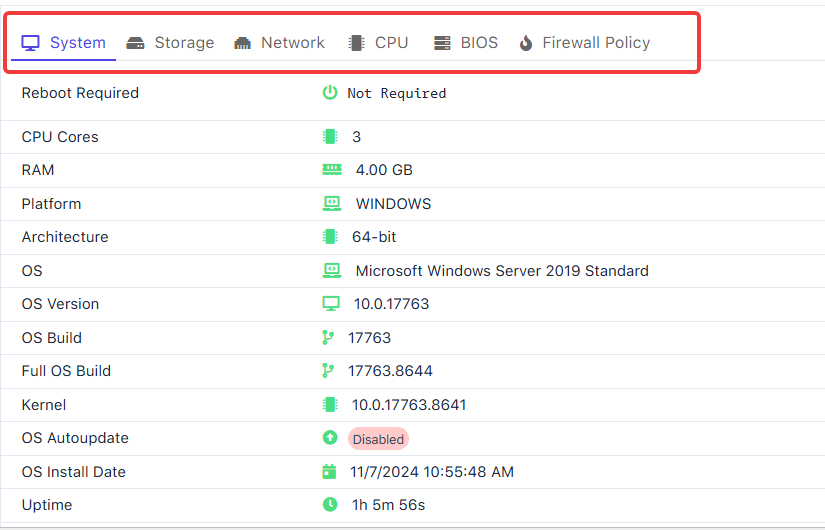
| Tab Name | Tab Description |
| System | Displays system information like hardware and operating system specs, uptime, and system maintenance details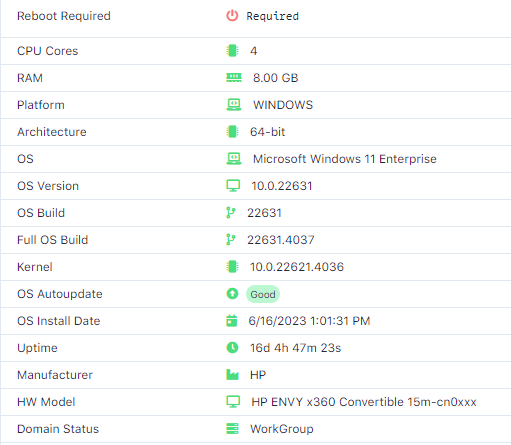 |
| Storage | Displays storage discovered with drive letter assignment and capacity status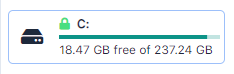 |
| Network | Displays the discovered network interfaces: WiFi, Bluetooth, Ethernet, LAN, etc.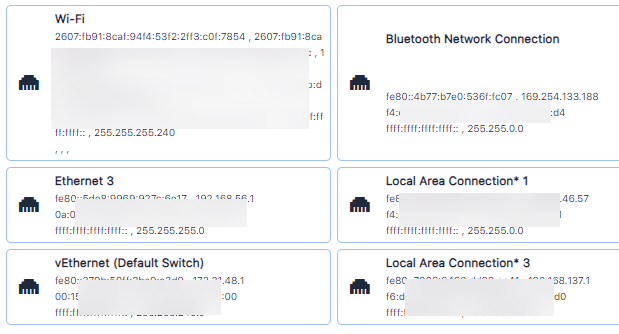 |
| CPU | Displays the CPU model, core, and speed specs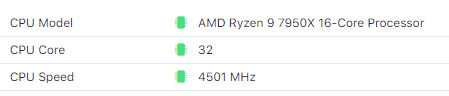 |
| BIOS | Displays the BIOS details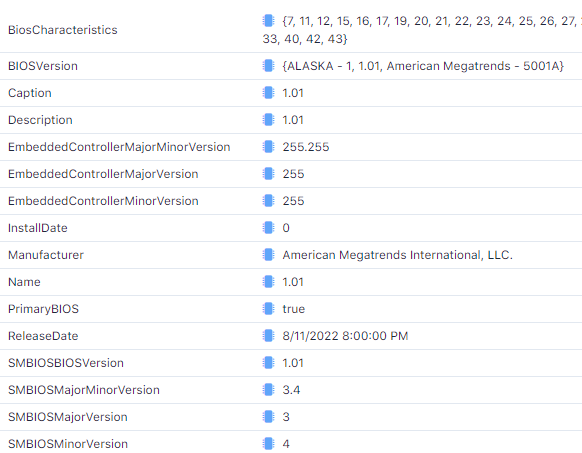 |
| Firewall Policy | Displays the local firewall policy; Domain, Public, and Standard Profiles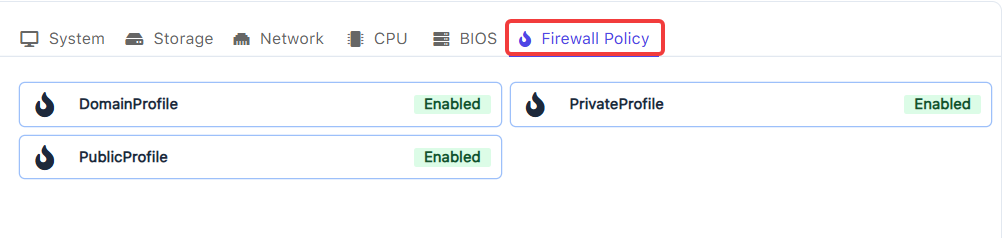 |
Network Assets - Fingerprint
Fingerprint data is only available for assets discovered by the probe scan; these assets do not have an agent installed.
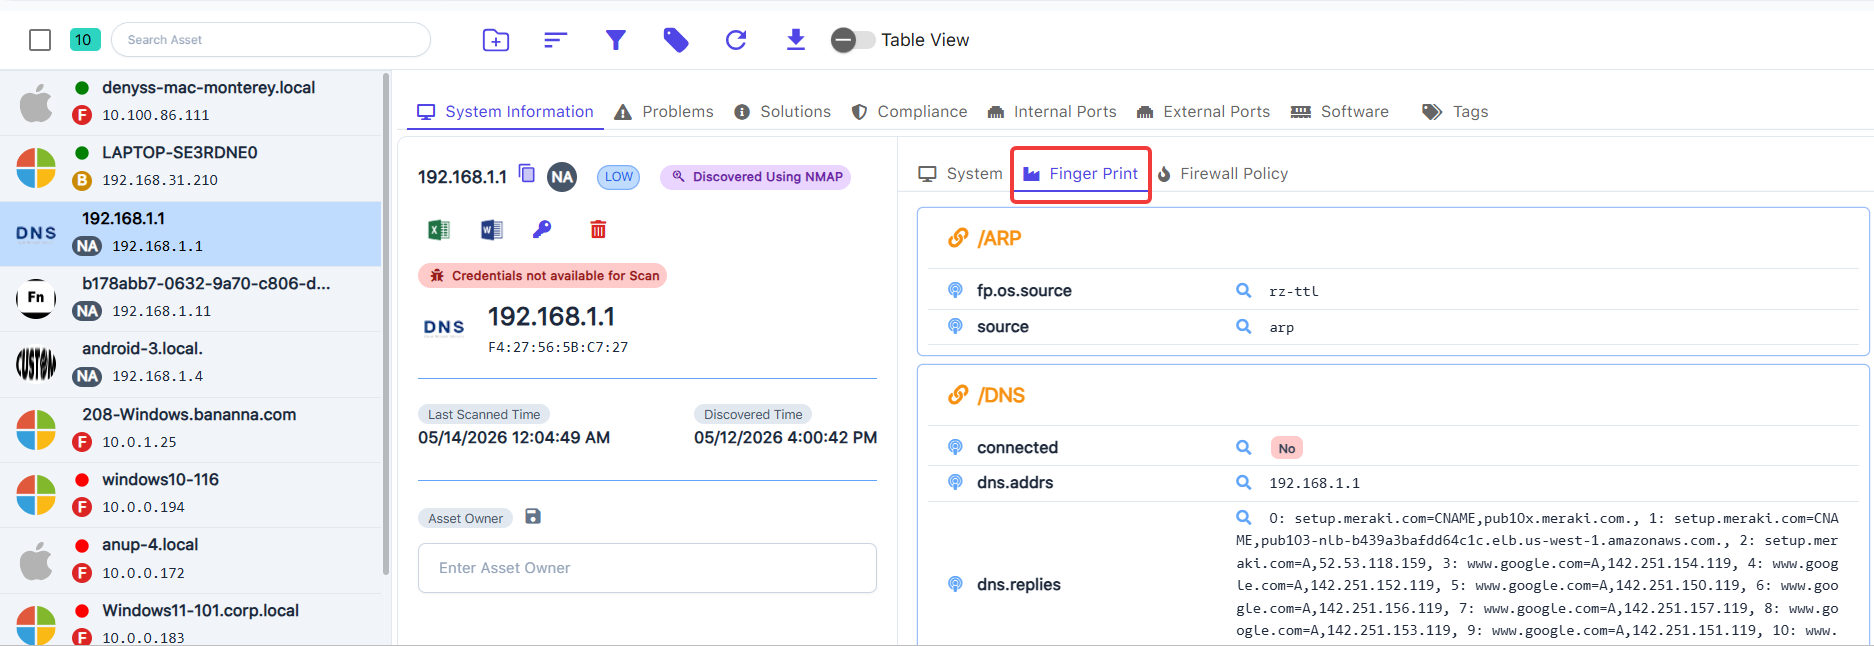
Fingerprint data is there to help to identify the assets further. This includes the following information:
| Category | Description |
| / ARP | mac, macDateAdded, macVendor, os.cpe23, source, osGuess, osGuessDetail, and source |
| / DNS | connected status, address, replies, resolvers, rtts, version bind, and protocol |
| / ICMP | duplicate packets status, rtt, typeCode, typeCodeN, flags, frag, id, len, proto, tos, TTL, path.mtu, ping stats, scan duration, and timestamp |
| / MDNS | protocol, ts |
| / NETBIOS | address, mac, macDateAdded, macVendor, protocol, status, and ts |
| / 443 TLS | banner, HTTP body, HTTP code, contentSecurityPolicy, contentType, head.date, head.server, xFrameOptions, message, port, protocol, and tls info |
| / 80 TLS | banner, HTTP body, HTTP code, contentSecurityPolicy, contentType, head.date, head.server, xFrameOptions, message, port, protocol, and tls info |
| / Basic Asset | OsGuess, hostname, mac, manufacturer |
The following pod information in system information contains:
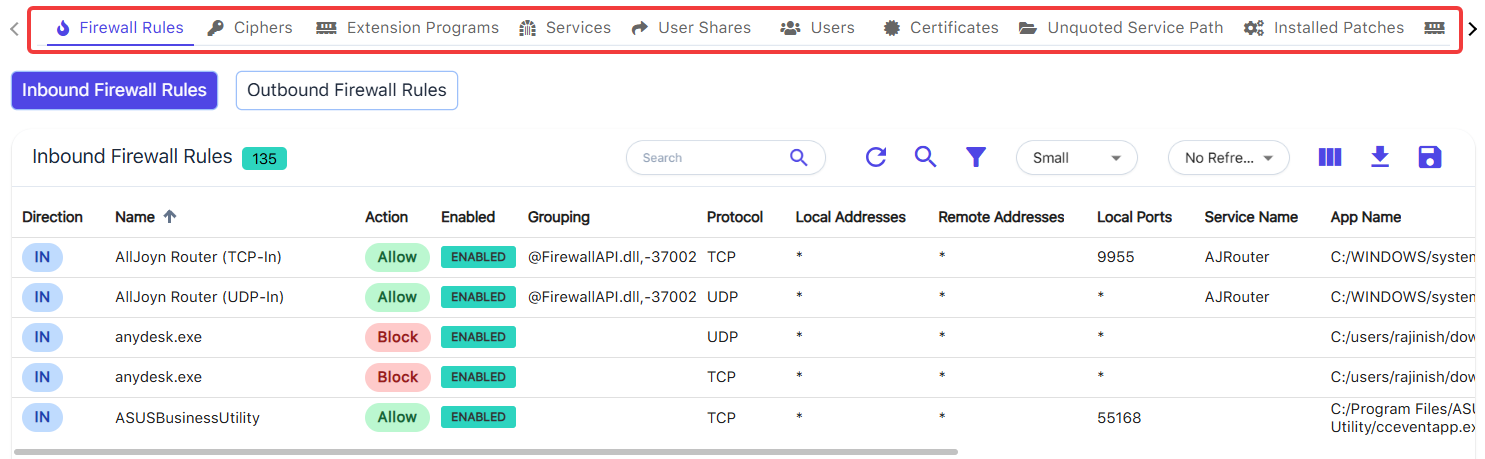
| Tab Name | Description |
| Firewall Rules | Displays the local Firewall Rules for the selected asset. You can toggle between Inbound and Outbound rules.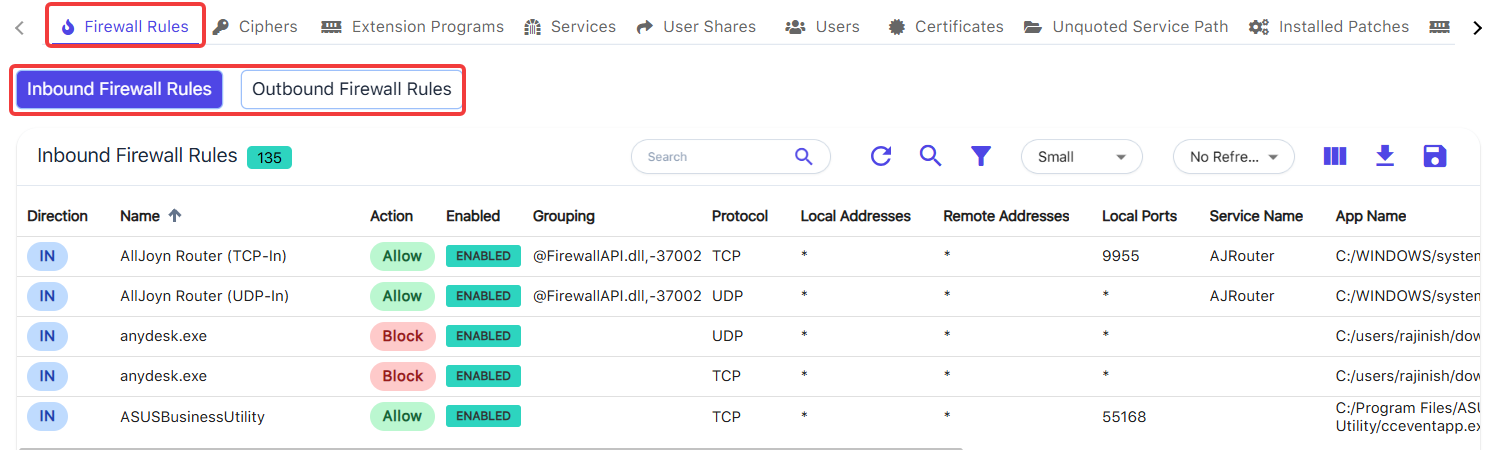 |
| Ciphers | Cipher data is populated for probe-discovered assets, as it’s fetched directly from the Nmap scan results. Lightweight assets do not include cipher data by default. If you’d like to collect cipher data for those assets, you can set up a probe machine mapped to all the assets and run a Network Scan. This will retrieve the required cipher information. 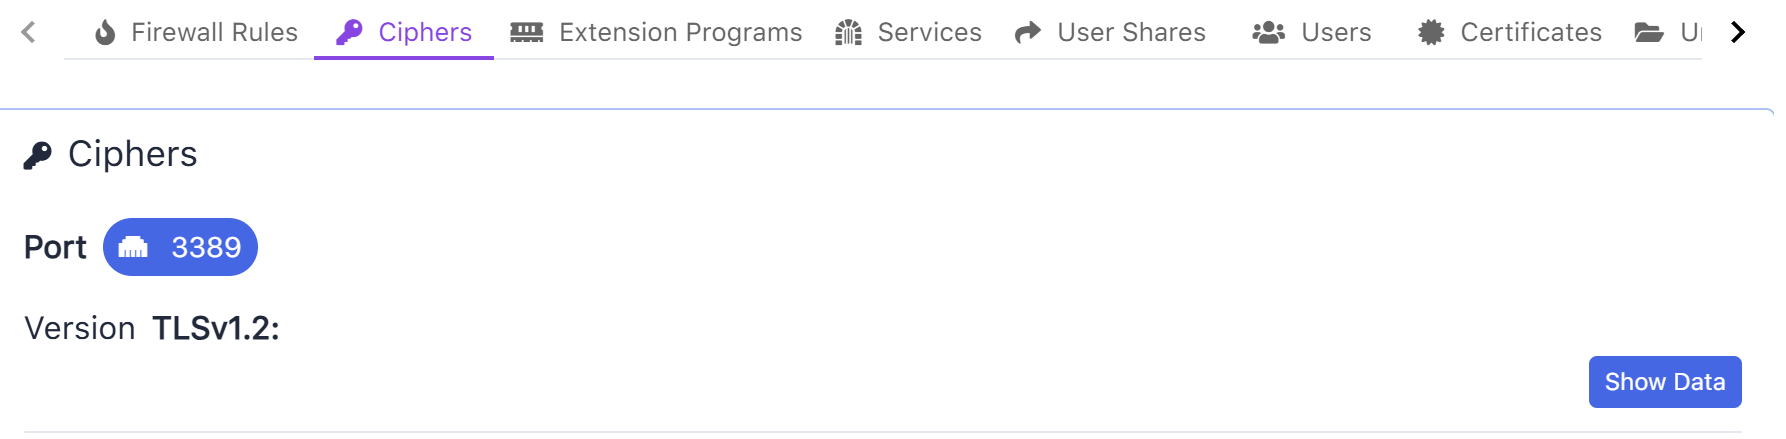 |
| Extension Programs | Displays the detected browser extension programs for the selected asset.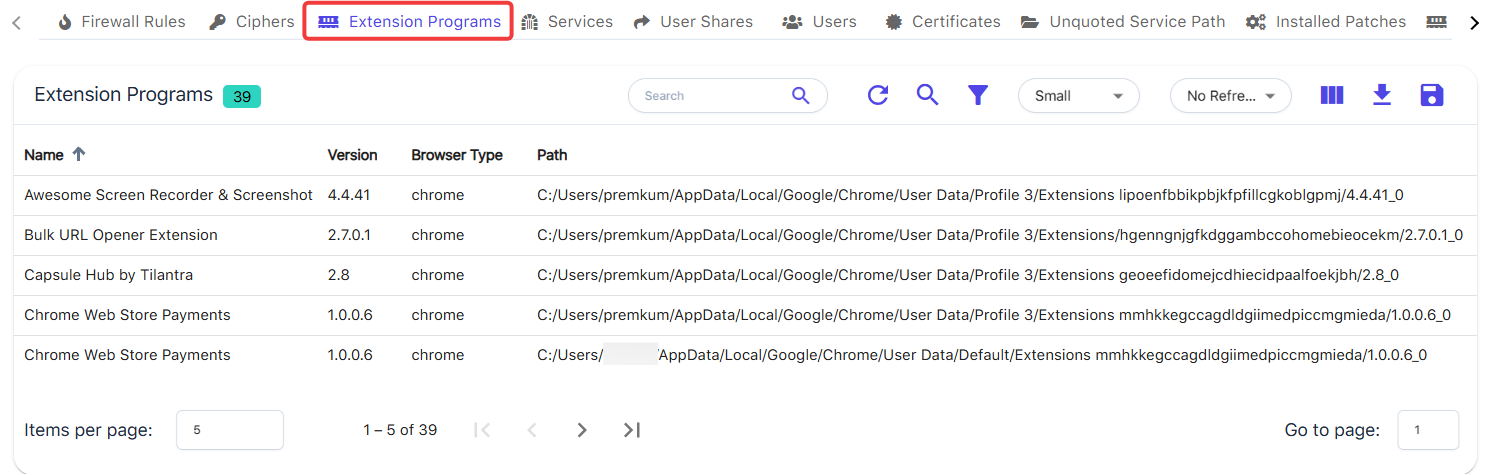 |
| Services | Displays the detected Services with the current status, user account, and path information.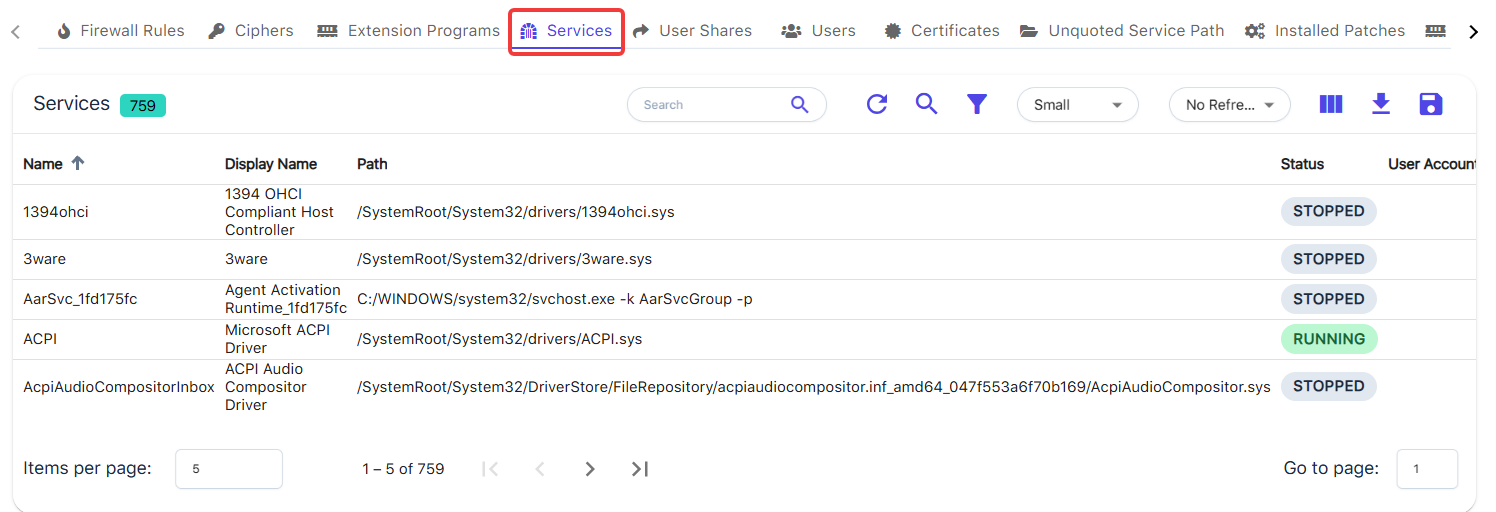 |
| User Shares | Displays the detected User Shares from the asset; tap between the share names to browse the data.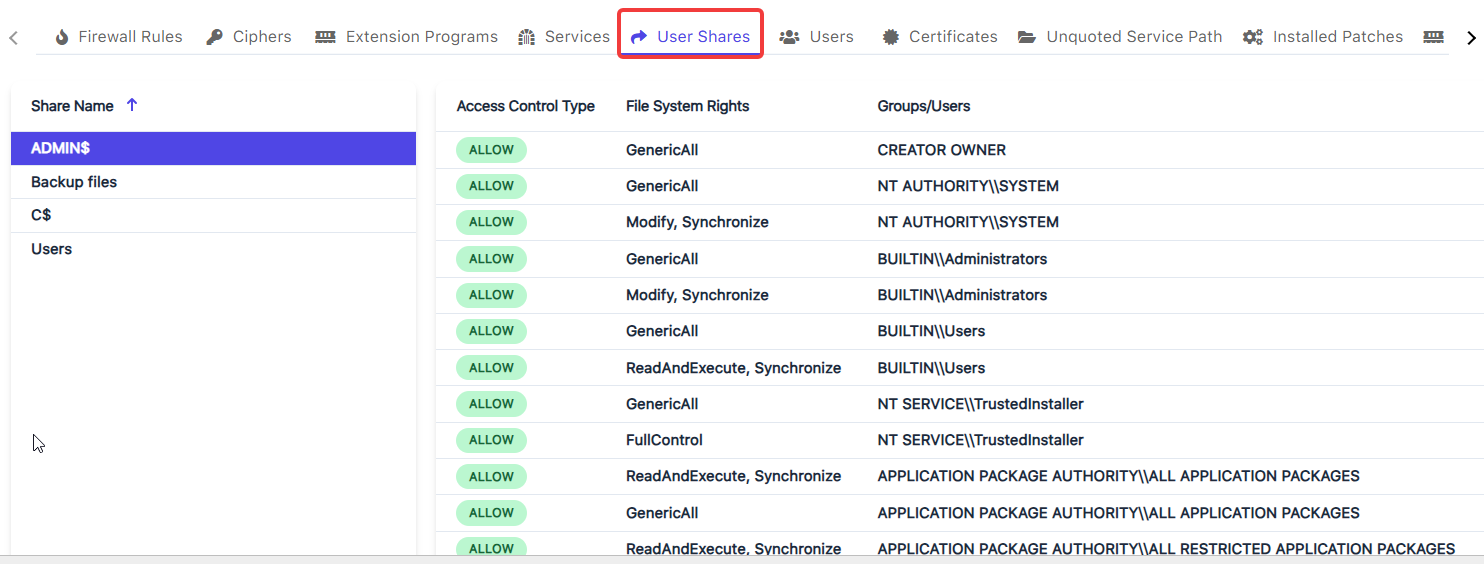 |
| Users | Displays the detected User(s) accounts from the asset.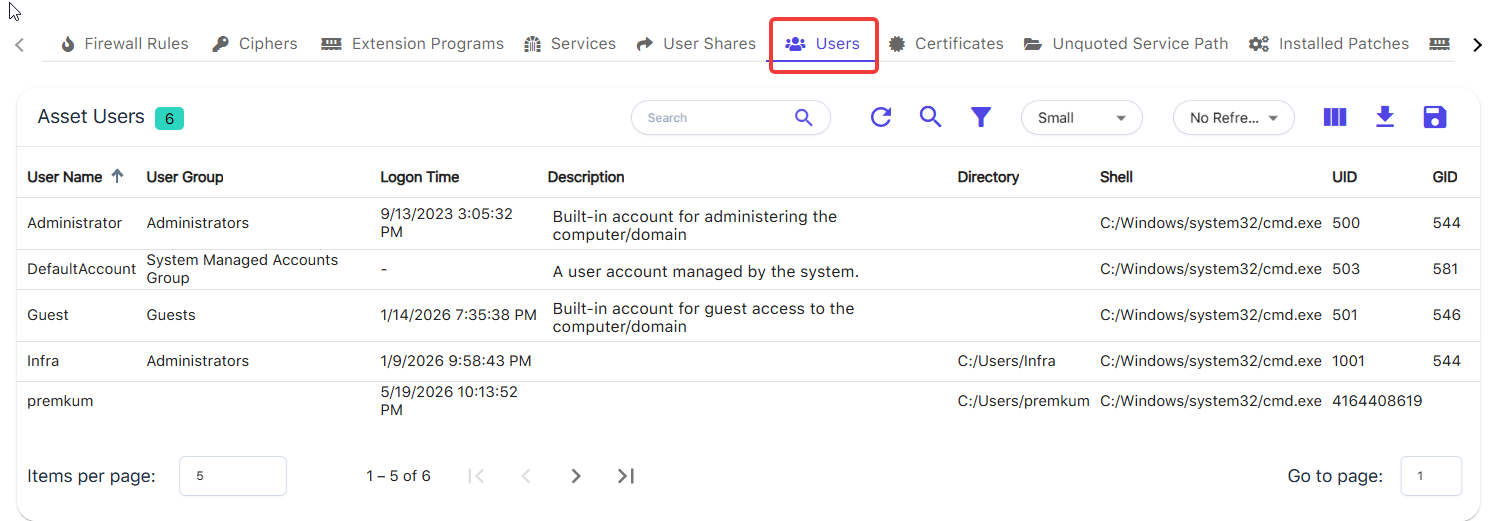 |
| Certificates | Displays detailed information about SSL/TLS certificates detected on the asset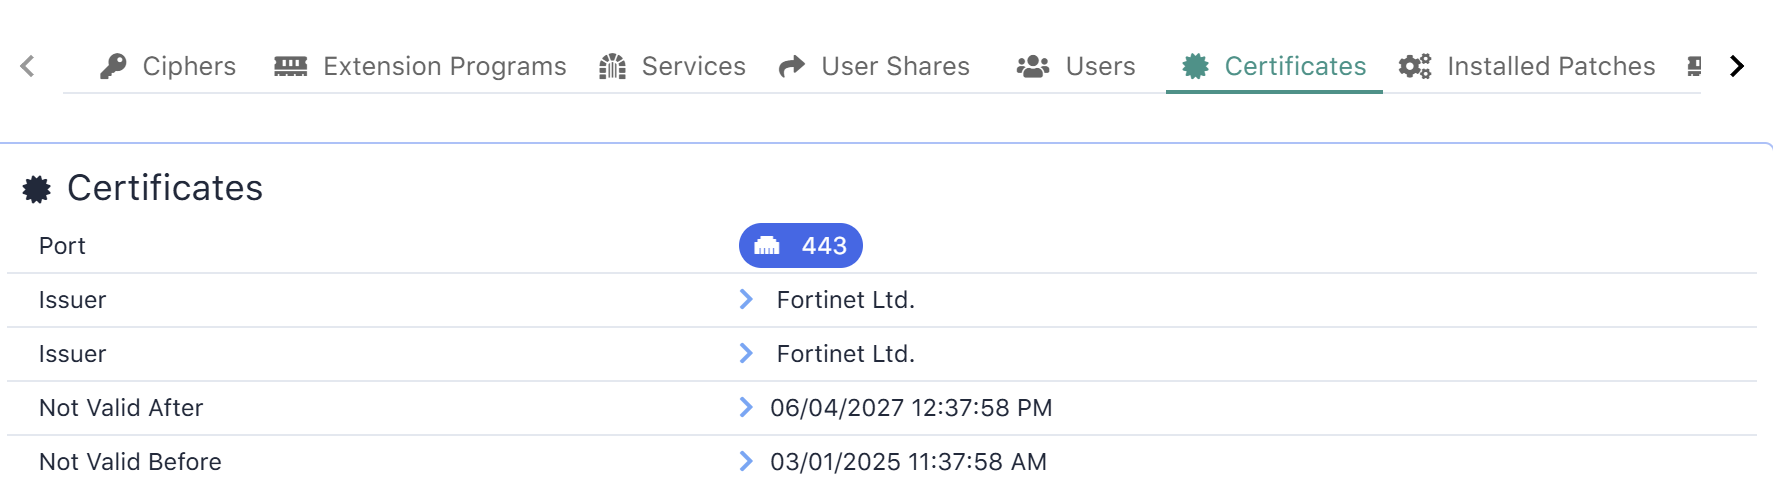 |
| Unquoted Service Path | Displays any detected service with an unquoted service path.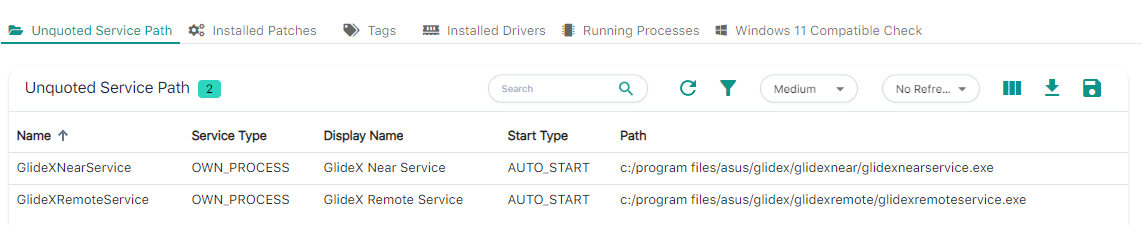 |
| Installed Patches | Displays the detected installed security patches.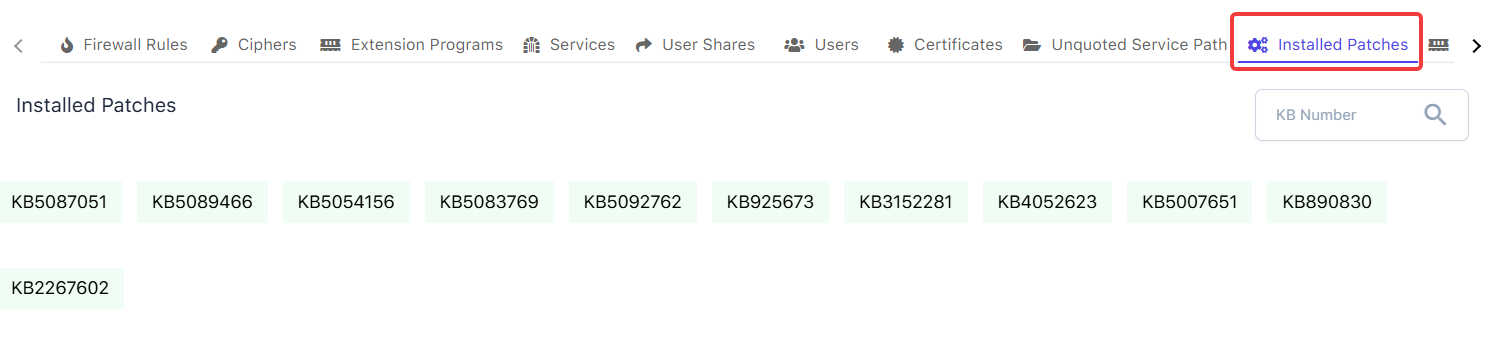 |
| Installed Drivers | Displays the detected installed drivers for the selected asset.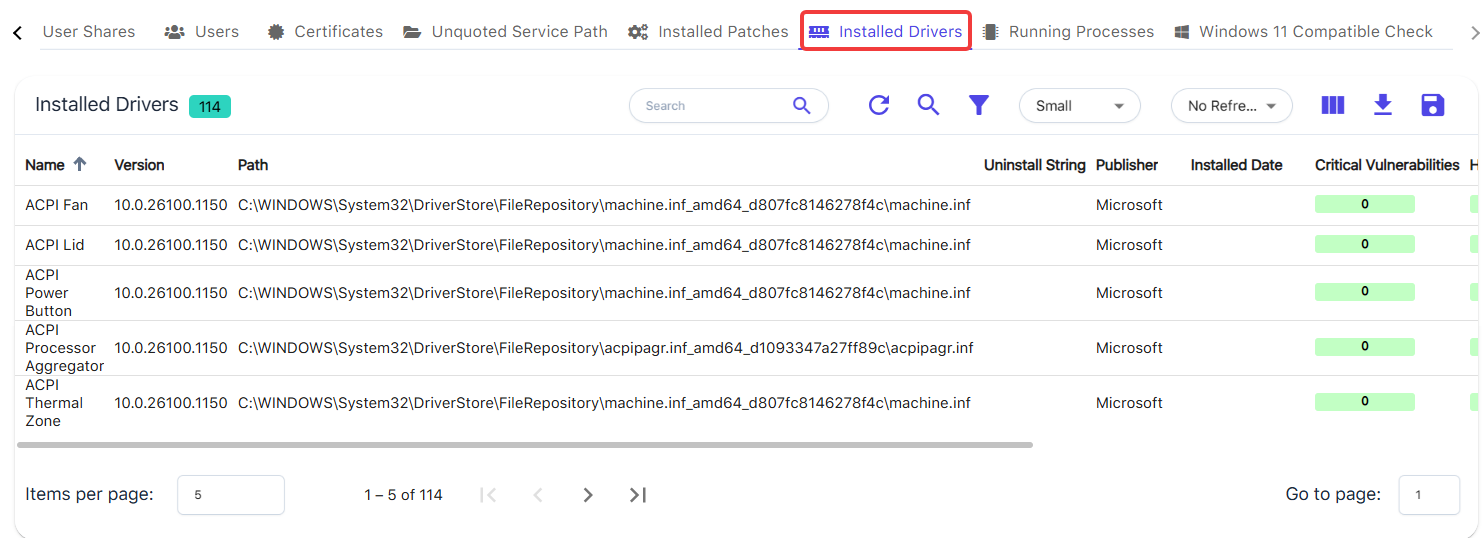 |
| Running Processes | Displays the detected running system processes for the selected asset.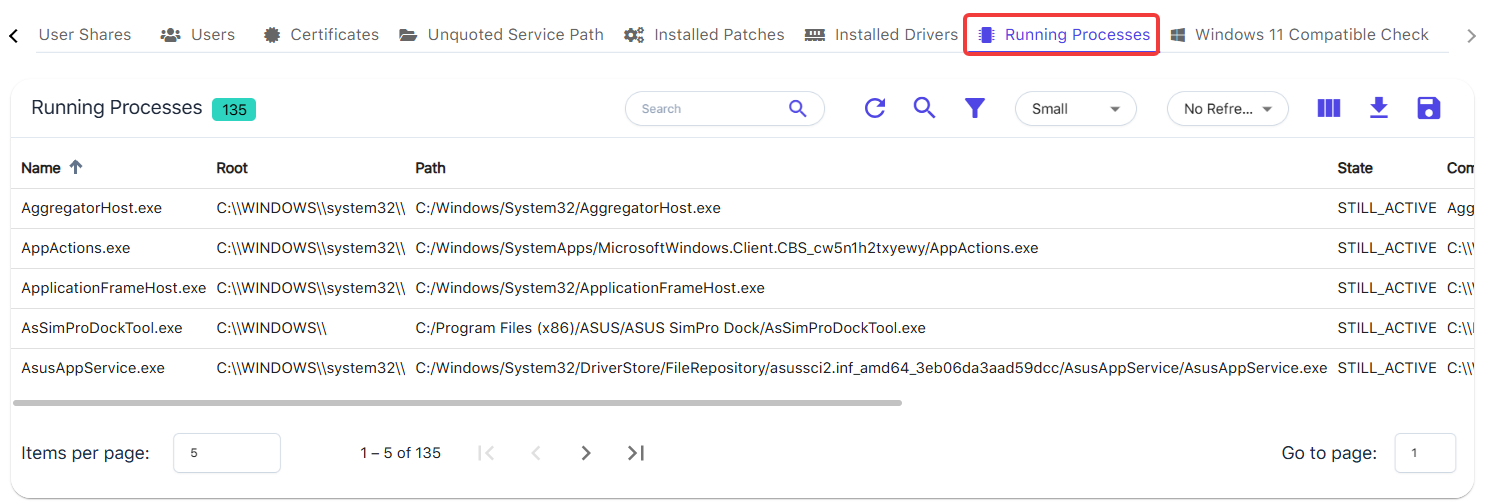 |
| Windows 11 Compatible Check | Microsoft Windows Assets Only Displays the Windows 11 compatibility check information. 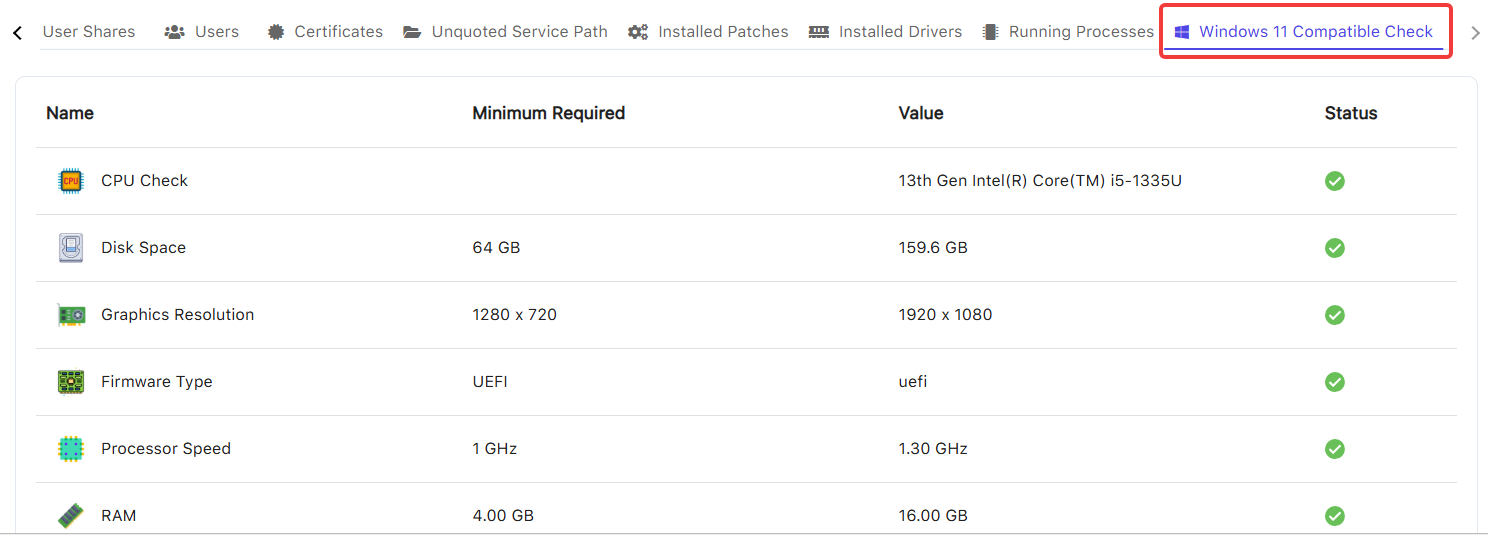 |