


Common Tasks in Advanced Reporting
Step-by-step instructions for the common tasks in Advanced Reporting.
Pick the Data I Want
- Click 'Create report'.
- Click the database, then scroll or search the table list. Or type a name in the top search box.
- Click the table. The first rows appear in a grid (up to 2,000 rows shown).
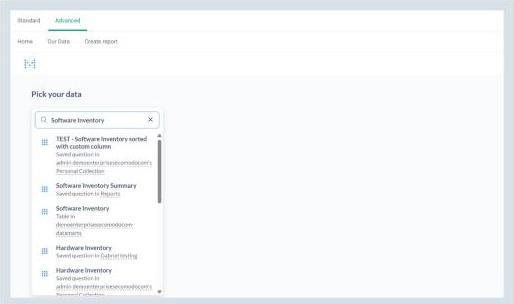
Searching shows tables and saved reports, each labelled with where it lives.
Available Tables
Antivirus Health History, Antivirus Scan History, Av Db States, Device Group, Hardware Inventory, Metadata, Os, Patch Compliance Devices, Patch Compliance Patches, Patches Ref, Remote Tools Sessions, Software Inventory, Software Version History, Threat Activity, Time By Day, Tmp Device Group and User.
Tip: You can also start from 'Saved Questions' to build on a report that already exists.
Filter Rows
Filter by Date
- Click 'Filter'. A list of every field in the table opens.
- For a date field, click a quick button: 'Today', 'Yesterday', 'Last Week' or 'Last Month'. Click '...' for more: 'Last 7 Days', 'Last 30 Days', 'Last 3 Months', 'Last 12 Months', 'Specific dates...'.
- Click 'Apply Filters'.
- Your filter shows as a chip under the title. Click the x on the chip to remove it.
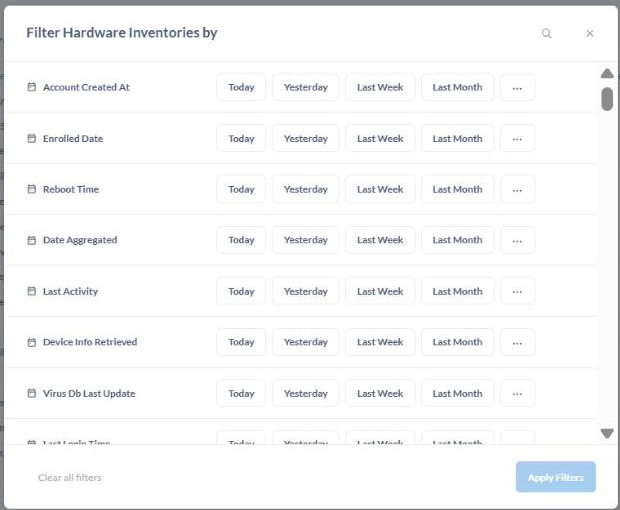
The 'Filter' window lists every field. Date fields have quick buttons.
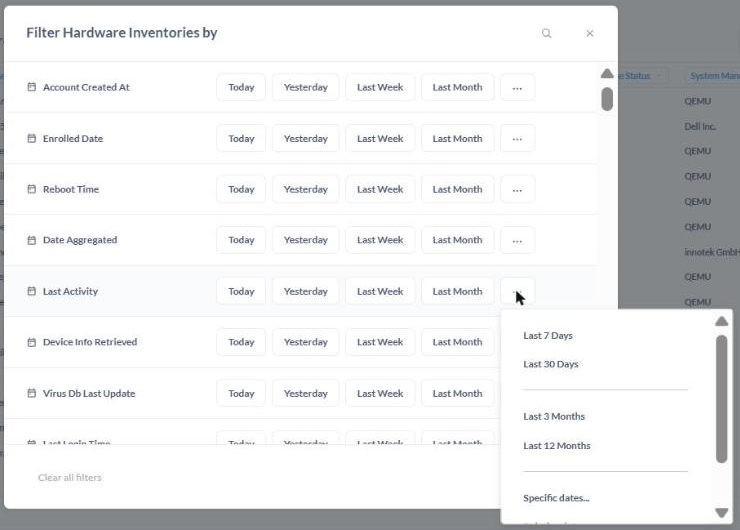
The '...' menu next to a date field: 'Last 7 Days', 'Last 30 Days', 'Last 3 Months' and more.
Use the search icon at the top of the dialog to find a field by name, and 'Clear all filters' to start over. A number badge next to the 'Filter' button shows how many filters are
active.
Note: If your filter leaves nothing, the screen says 'No results!' with a 'Back to previous results' button. Remove or widen the filter.
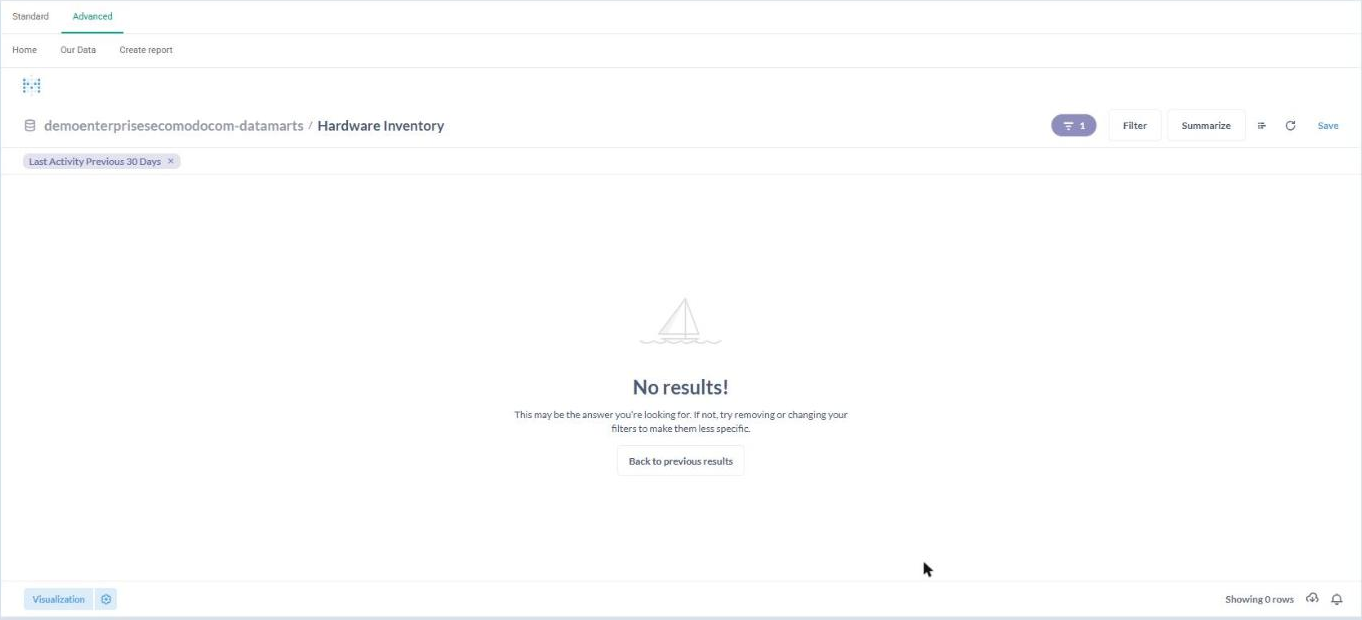
A filter that removes every row shows 'No results!' with a 'Back to previous results' button. The filter chip sits under the title.
Filter by Text
- Click 'Filter' and find a text field, for example 'Device Name'.
- Click the small operator link next to the field name (it says 'is') and choose one: 'Is', 'Is not', 'Contains', 'Does not contain', 'Is empty', 'Not empty', 'Starts with', 'Ends with'.
- Click the box and start typing. Matching values are suggested as you type.
- Click the value you want in the suggestion list.
- Click 'Apply Filters'. The chip shows the field, the operator and the value.
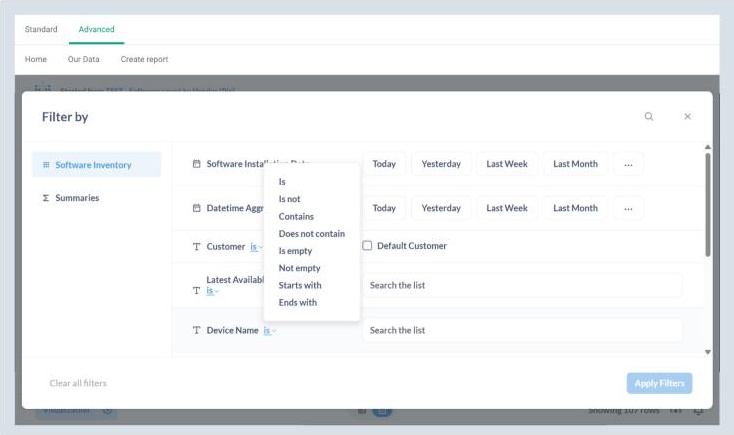
Step 2: the operator list for a text field ('Is', 'Is not', 'Contains' and so on).
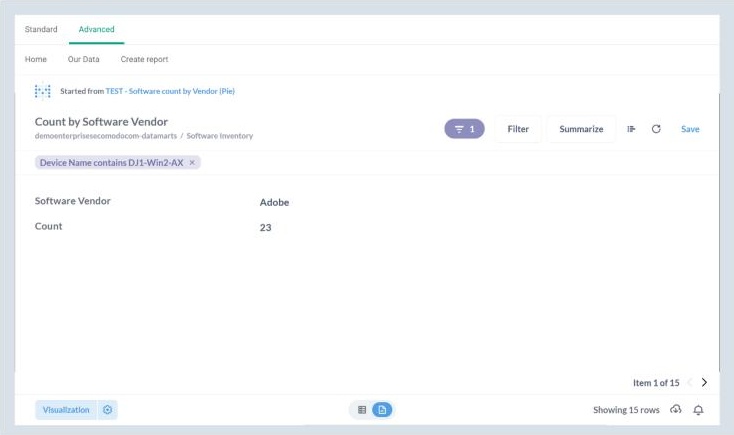
The applied text filter shows as a chip under the report title.
Note: If you type part of a name and press Enter, the first suggestion is chosen, not the text you typed. To filter on a part of a name, pick the exact value from the suggestions, or choose the value you really want.
Some short lists, such as 'Customer', show a tick box (for example 'Default Customer') instead of a text box. Tick the value you want.
The filter window has a list on the left. Your table name holds filters on the original rows. 'Summaries' holds filters on totals that you have calculated (for example only vendors with a count above 100).
Count and Group (Summarize)
- Click 'Summarize'.
- 'Summarize by' starts as 'Count'. Click '+' to add another measure, or x to remove one.
- Under 'Group by', click one or more fields, or type in 'Find...' to search.
- Click 'Done'. The report title updates itself, for example 'Count by Software Vendor'.
Tip: For number and date fields, click the group-by chip to change how values are bucketed (for example 'Auto binned').
Add More Measures to a Summary
- Click 'Summarize', then the '+' next to 'Count'.
- In 'Basic Metrics', choose one: 'Count of rows', 'Number of distinct values of...', 'Cumulative count of rows', 'Minimum of...', 'Maximum of...' and others further down the list. The '?' beside each one explains it.
- For measures that apply to a field, pick the field (for example 'Software Name').
- Click 'Done'. Each measure becomes its own column or series, and the title updates, for example 'Count and Distinct values of Software Name by Software Vendor'.
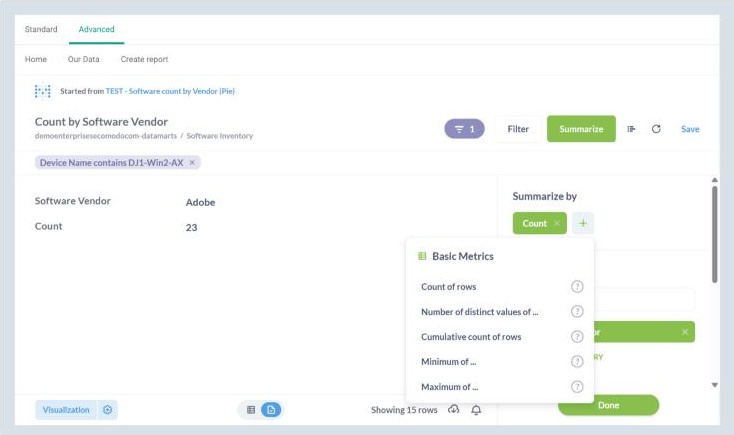
Step 2: the 'Basic Metrics' list after clicking '+' next to 'Count'.
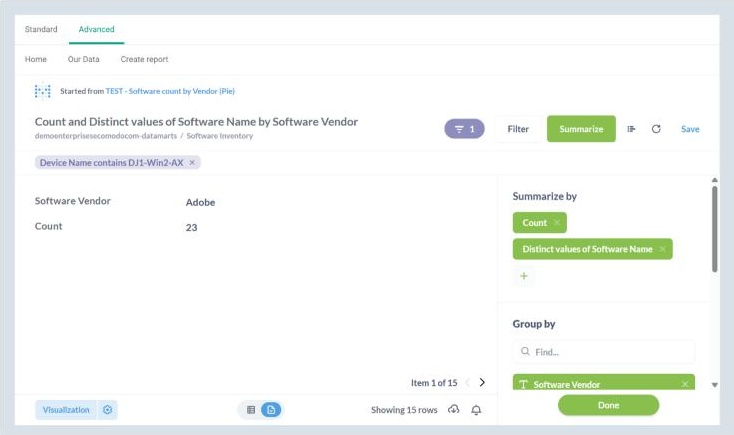
Two measures in one summary. The title updates automatically.
Use the x on a measure chip to remove it. Add more than one 'Group by' field to split the summary further.
Change How It Looks (Chart or Table)
- Click 'Visualization' at the bottom left.
- Click a chart type (see 'Chart Types').
- Click 'Done'.
- Use the small table / chart switch at the bottom to flip between the data table and the chart.
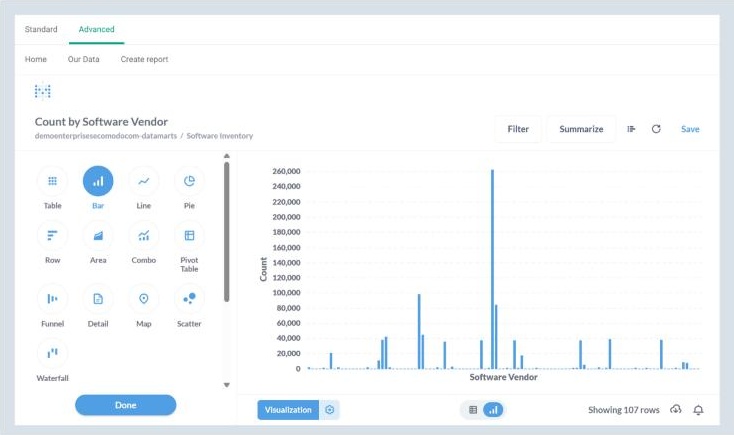
The Visualization picker lists the chart types that suit your data.
Note: When you change a saved report (filter, summarize, chart type) the original is not overwritten. The header shows 'Started from' and the report name, and the changes only become permanent if you click 'Save'. This makes it safe to experiment.
Fine-Tune a Chart
- Click the gear next to 'Visualization' (or the gear on the selected chart type).
- 'Data' - choose the X-axis field and Y-axis series.
- 'Display' - turn on 'Goal line' or 'Show values on data points'.
- 'Axes' - set 'Show label', 'Label', 'Show lines and marks' and 'Scale' for each axis.
- Click 'Done'.
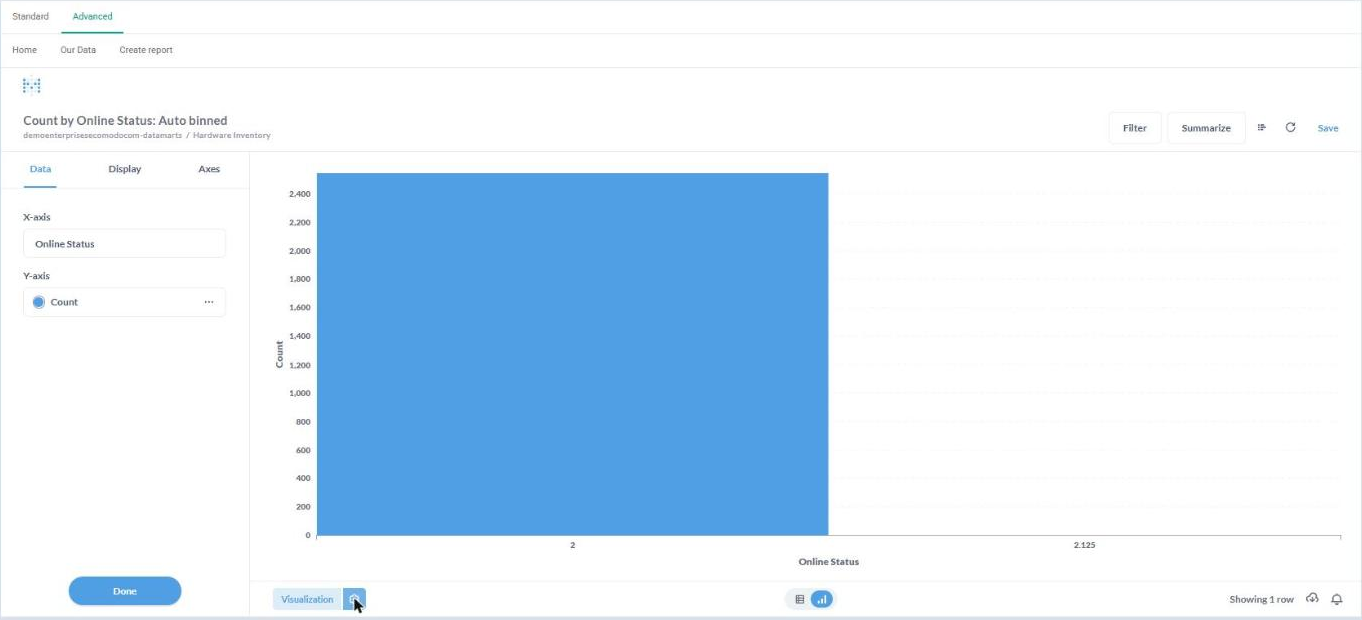
Chart settings (gear): the 'Data', 'Display' and 'Axes' tabs open on the left.
Build a Multi-Step Report (Editor)
Click the editor icon (the list icon in the toolbar). Your report appears as steps you can edit:
- 'Data' - the table you started from. Small icons under it add a 'Filter', 'Summarize', 'Join', 'Custom column' or 'Sort' directly.
- 'Filter', 'Summarize', 'Join data', 'Custom column', 'Sort', 'Row limit' - add these steps with the buttons under the last step.
- 'Visualize' - runs the report.
Click 'Visualize' after any change to run the report again.
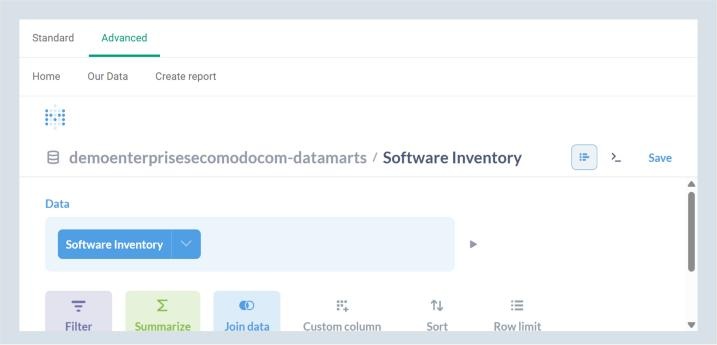
The editor: the 'Data' step, with 'Filter', 'Summarize', 'Join data', 'Custom column', 'Sort' and 'Row limit' buttons below.
Sort the Results
- In the editor, click 'Sort'.
- Choose the field to sort by.
- Click the arrow on the chip to switch between ascending and descending. Click '+' to add a second sort field, or x to remove one.
- Click 'Visualize'.
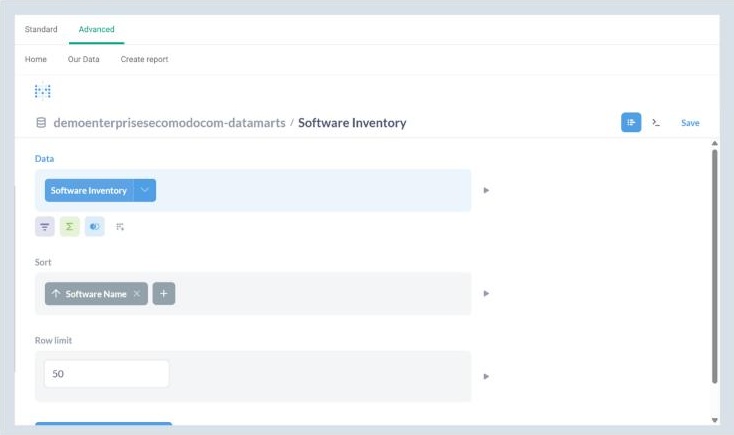
A 'Sort' step with one field. Click the arrow to change direction, and '+' to add another field.
Limit the Number of Rows
- In the editor, click 'Row limit'.
- Type a number in 'Enter a limit' (for example 50).
- Click 'Visualize'. The bottom right shows 'Showing 50 rows'.
Add a Calculated (Custom) Column
- In the editor, click 'Custom column'.
- In 'Expression', type a formula using field names in square brackets. Example: concat([Software Name], " ", [Software Version]).
- In 'Name', type a clear column name, for example Name and Version.
- Click 'Done', then 'Visualize'. The new column appears at the right end of the table.
Tip: Click the small 'i' next to 'Expression' for the list of functions you can use.
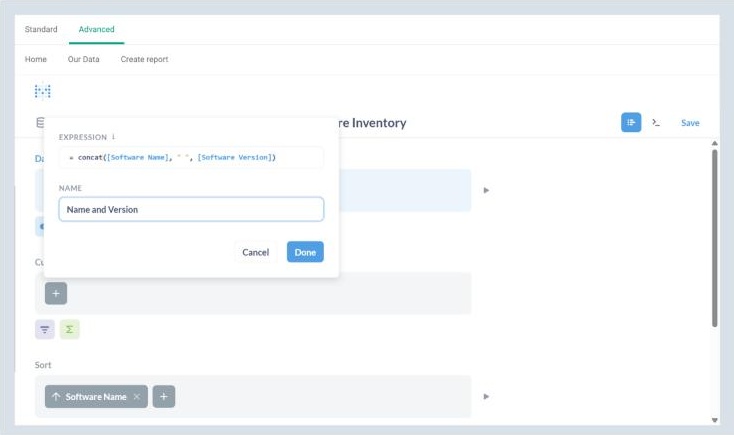
The 'Custom column' dialog with an expression and a name.
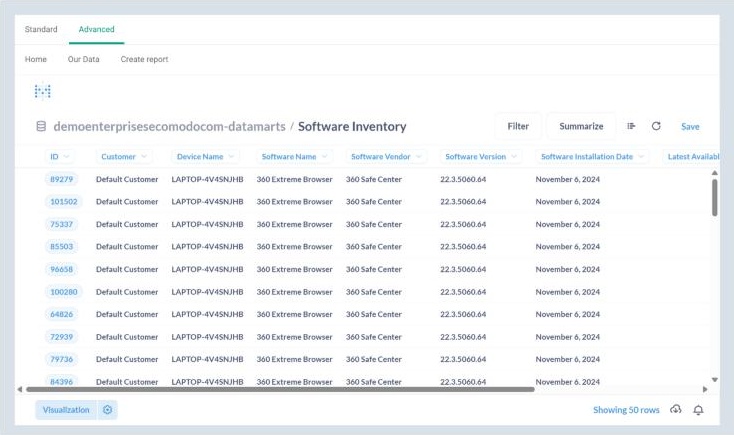
The finished report: 50 rows ('Row limit'), sorted by 'Software Name'.
Combine Two Tables (Join)
- In the editor, click 'Join data'.
- Choose the second table.
- Choose the field from the first table, then the matching field from the second table. Click '+' to add another matching pair.
- Click the join-type icon between the table names and choose: 'Left outer join' (all rows from the first table), 'Right outer join', 'Inner join' (only matching rows) or 'Full outer join'.
- Click 'Visualize'.
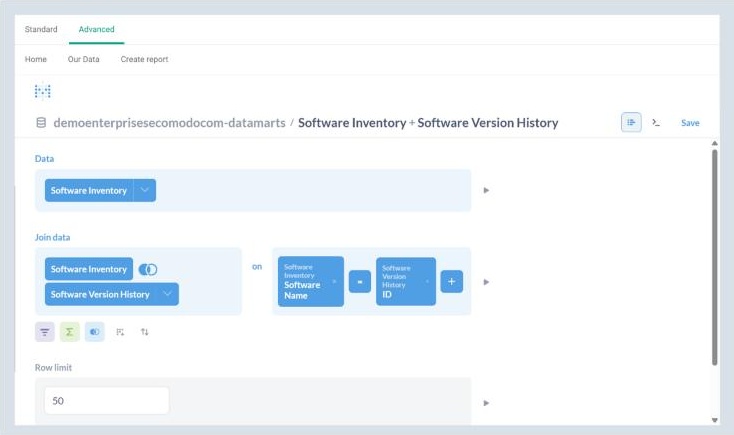
A 'Join data' step: two tables and the matching fields. The '+' adds another pair.
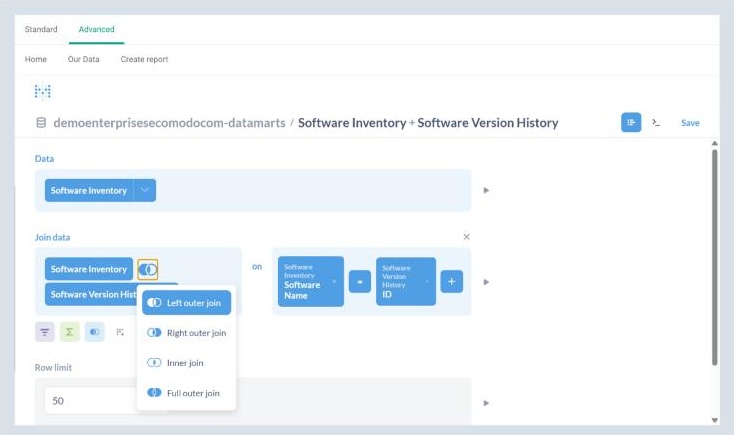
The join-type icon opens: 'Left outer', 'Right outer', 'Inner' and 'Full outer join'.
Note: Match fields that mean the same thing (for example 'Device ID' to 'Device ID'). Matching unrelated fields causes the error 'There was a problem with your question'.
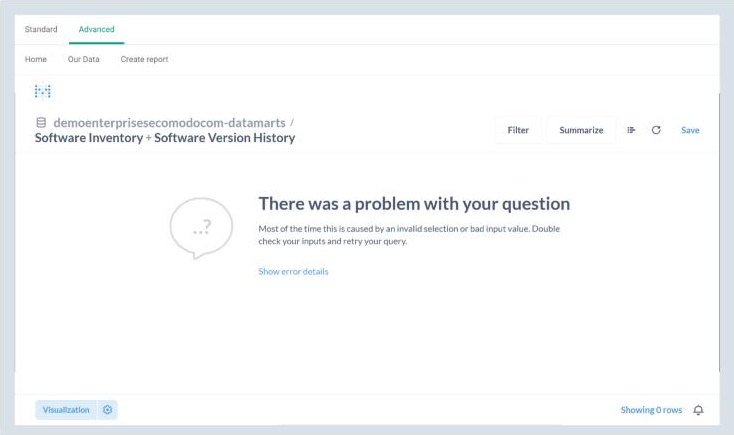
Joining unrelated fields gives 'There was a problem with your question'. Fix or remove the last step.
To remove a join, click the x at the top right of the 'Join data' step.
Save a Report
- Click 'Save'.
- Type a 'Name'. A name is suggested from your settings. Replace it with something clear.
- Add a 'Description' (optional but helpful).
- Check 'Which collection should this go in?'. The default is your personal collection.
- Click 'Save'.
Open, Review and Organise Saved Reports
- Open 'Home' > 'Your personal collection' (or search for the name) to find a saved report.
- Click the 'i' icon to see the description and history (who created it and when).
- Click the bookmark icon to mark a report as a favourite.
- Click '...' for more actions: 'Move', 'Duplicate', 'Turn into a model', 'Archive' and 'Add to dashboard'.
- 'Duplicate' asks for a name (it adds ' - Duplicate'), a description and a collection. Use it before experimenting with a report you want to keep.
- 'Move' shows your collections and '+ New collection'. Pick one and click 'Move'.
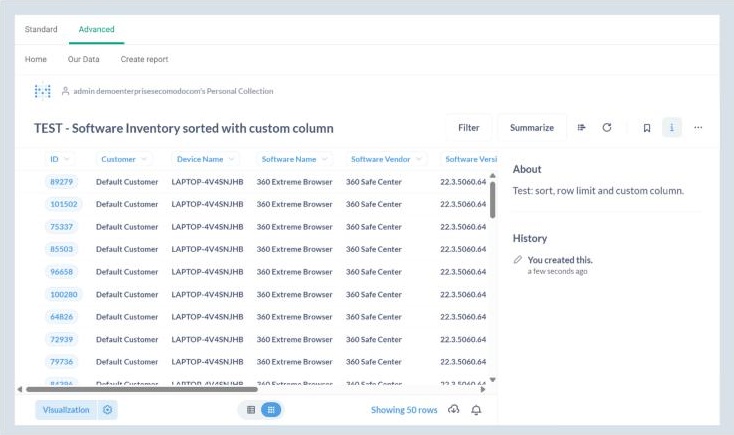
A saved report: breadcrumb, title, toolbar, bookmark, info ('i') and '...' icons. The info panel shows the description and history.
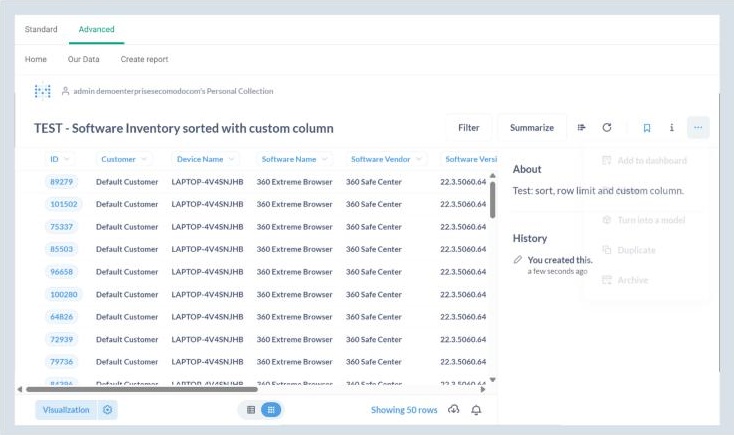
The '...' menu: 'Add to dashboard', 'Move', 'Turn into a model', 'Duplicate', 'Archive'.
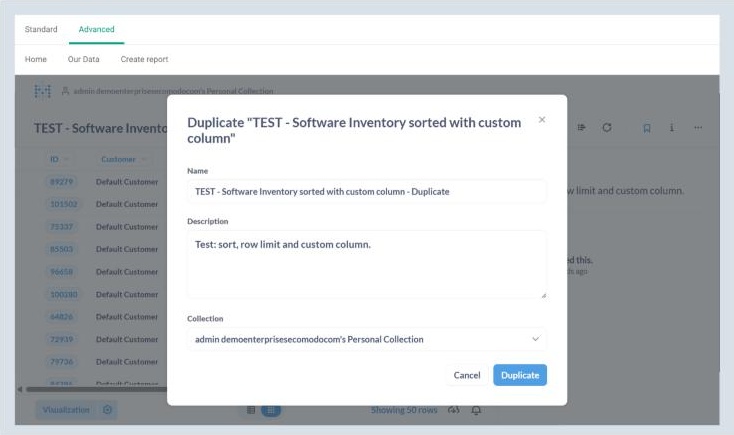
'Duplicate' asks for a name, a description and a collection.
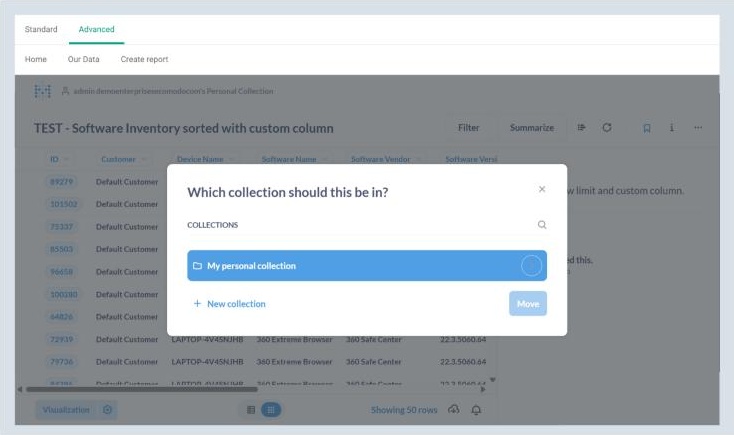
'Move': choose a collection or create a new one.
Note: 'Archive' removes a report from normal view. Only use it when you mean to.
Download Results
- Click the cloud / download icon at the bottom right.
- Under 'Download full results', choose .csv, .xlsx or .json.
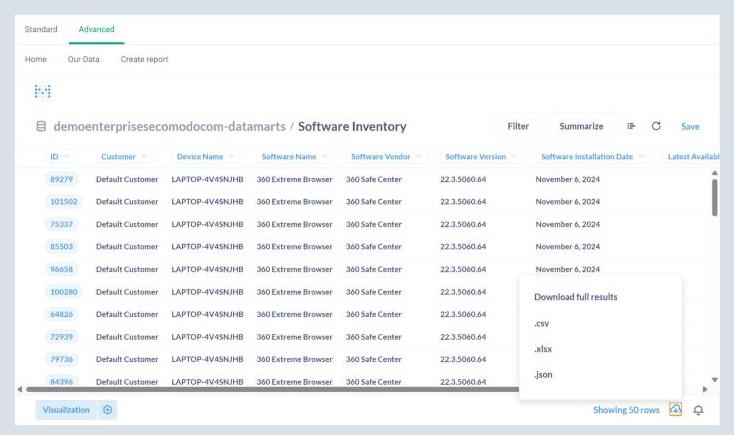
'Download full results': .csv, .xlsx or .json.
See the SQL Behind a Report
In the editor, click the '>_' icon. 'SQL for this question' shows the query that was generated.
Note: Do not click 'Convert this question to SQL' unless you want a SQL-only report. The change cannot be undone. Duplicate the report first.