


The Dashboard
The Dashboard is the screen the console opens on after you sign in. You can return to it at any time from the breadcrumb.
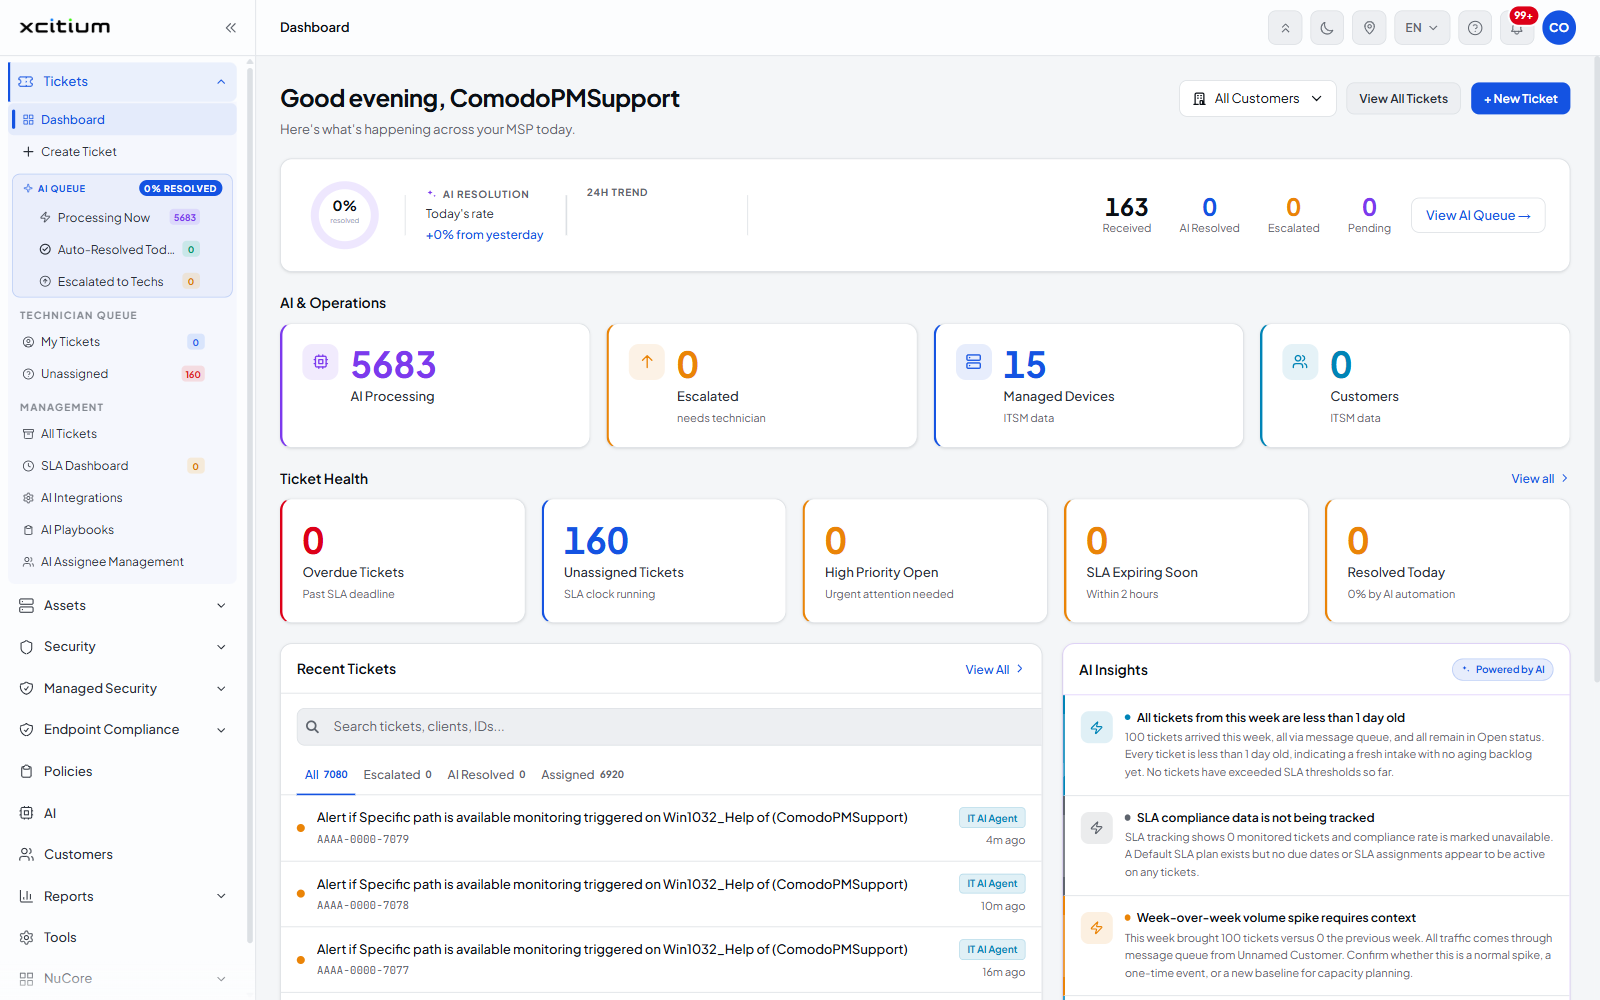
It is the summary of the service: how much work the AI has taken off the queue, how many devices and customers you are carrying, how healthy the ticket queue is, what has just come in, and what the platform thinks you should know.
You can filter the whole screen to one customer, open the ticket queues directly, and raise a new ticket without leaving the page.
The header
The screen opens with a greeting that uses your account name — for example 'Good evening, <account name>' — and the line 'Here's what's happening across your MSP today.' Three controls sit at the right:
| Button | Description |
| All Customers | The customer filter. See below. |
| View All Tickets | Opens the full ticket list in the Tickets module. |
| + New Ticket | Opens the form for raising a ticket. |
The customer filter
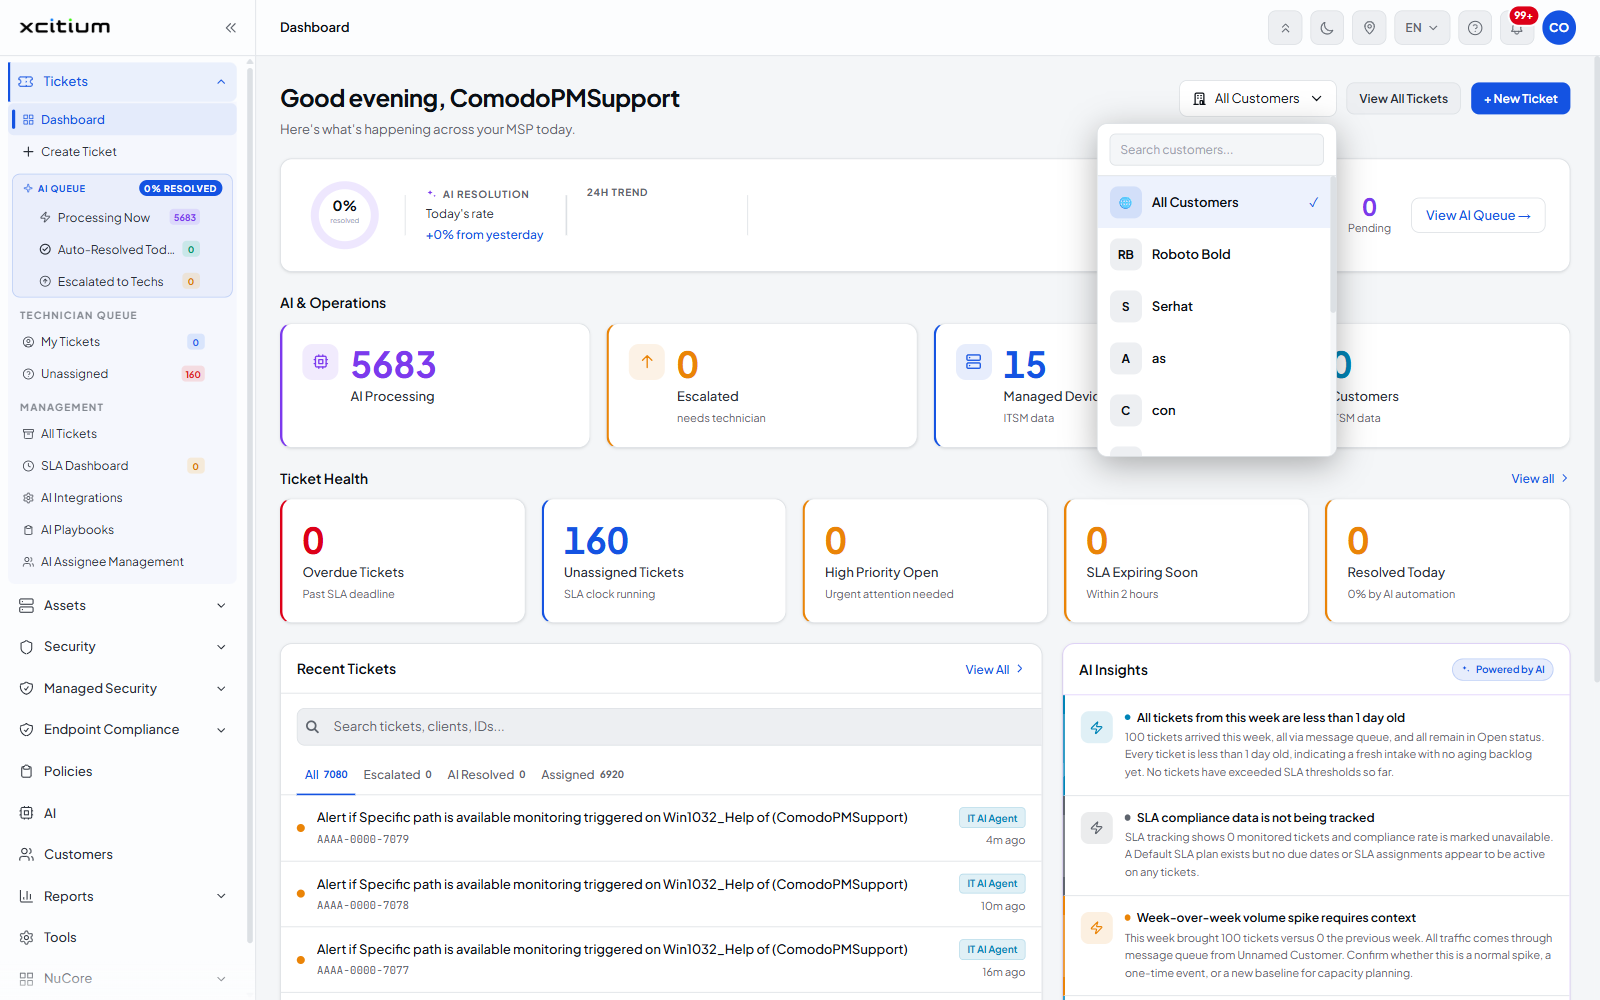
The filter narrows the whole dashboard to a single customer. It opens with a 'Search customers...' box, then 'All Customers' — the default, marked with a tick — and then one row per customer, each with an initials badge.
The AI Resolution banner
The band under the header reports what the AI queue has done today.
| Column | Description |
| (the ring) | A percentage ring labelled 'resolved', showing today's AI resolution rate. |
| AI RESOLUTION | The label for the ring, with the line 'Today's rate' beneath it. |
| 24H TREND | How today's rate compares with yesterday, for example '+0% from yesterday'. |
| Received | Tickets received today. |
| AI Resolved | Tickets the AI closed without a technician. |
| Escalated | Tickets the AI passed to a technician. |
| Pending | Tickets still with the AI. |
| View AI Queue | A link into the AI queue in the Tickets module. |
AI & Operations
Four cards covering the size of the estate and the AI workload.
| Column | Description |
| AI Processing | How many tickets the AI is working on. |
| Escalated | How many it has handed over, with the note 'needs technician'. |
| Managed Devices | How many devices you manage, with the note 'ITSM data'. |
| Customers | How many customers you manage, with the note 'ITSM data'. |
Ticket Health
Five cards covering the state of the queue, with a 'View all' link at the right of the heading.
| Column | Description |
| Overdue Tickets | Tickets past their SLA deadline, noted 'Past SLA deadline'. |
| Unassigned Tickets | Tickets with nobody on them, noted 'SLA clock running'. |
| High Priority Open | Open tickets marked high priority, noted 'Urgent attention needed'. |
| SLA Expiring Soon | Tickets whose SLA runs out shortly, noted 'Within 2 hours'. |
| Resolved Today | Tickets closed today, noted with the share closed by AI, for example '0% by AI automation'. |
Recent Tickets
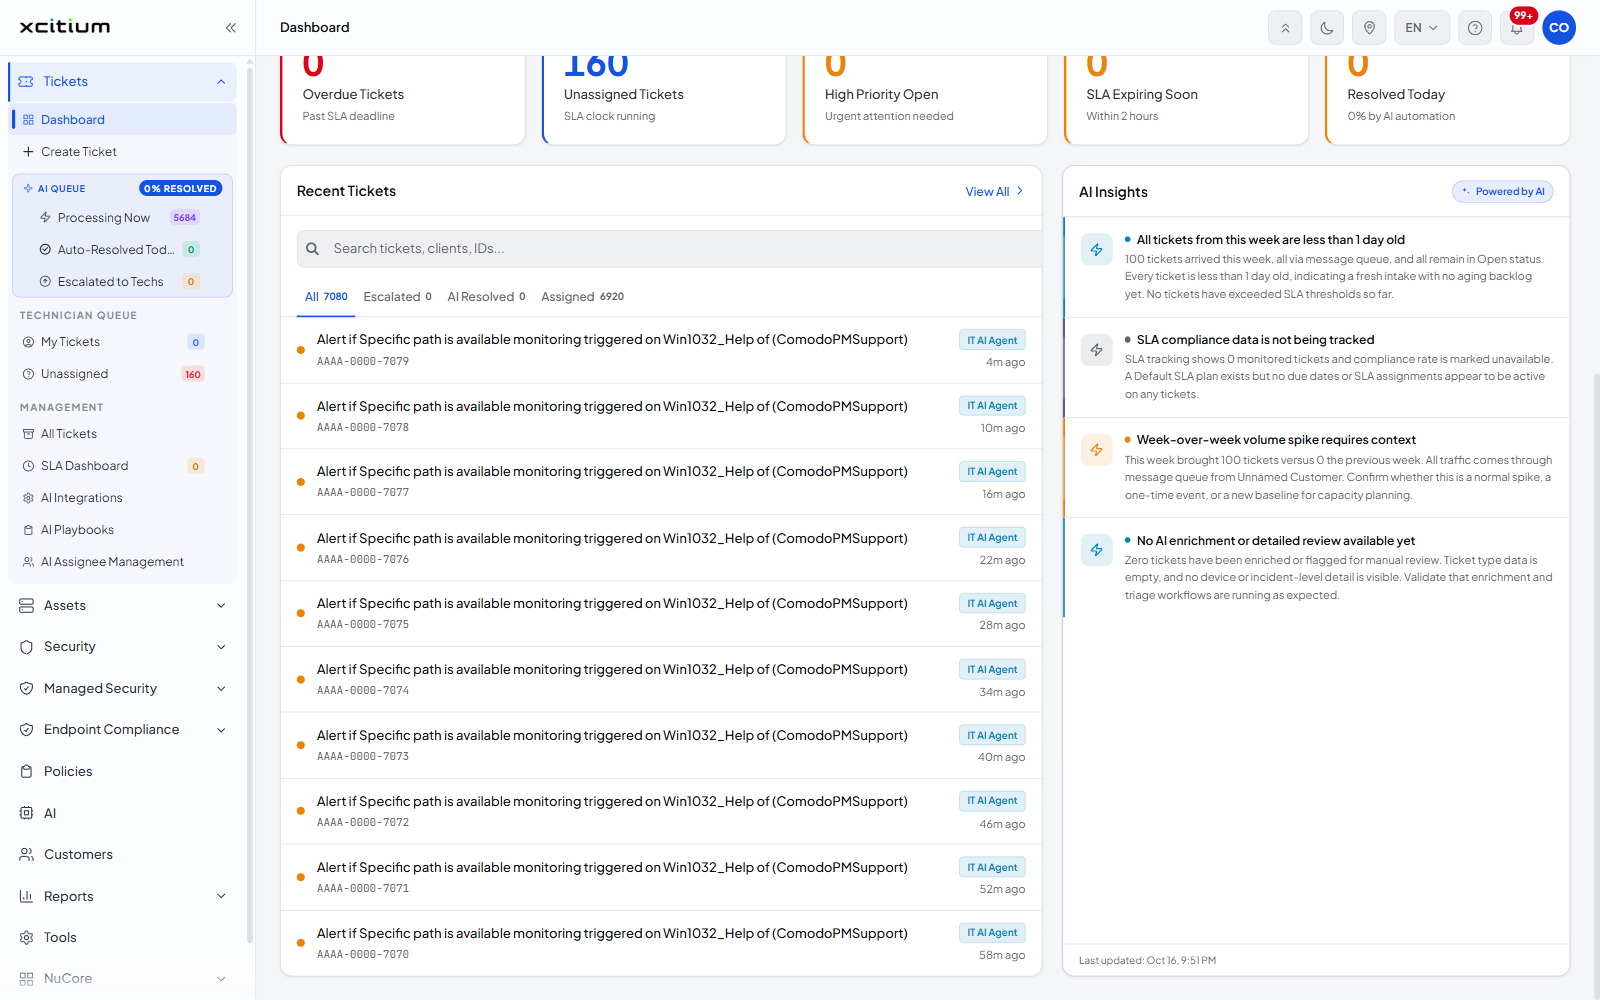
A panel listing the tickets that have just arrived, with a 'View All' link at the right of its heading.
It carries a search box with the placeholder 'Search tickets, clients, IDs...' and four tabs, each with a count: 'All', 'Escalated', 'AI Resolved' and 'Assigned'.
Each row shows a status dot, the ticket subject, the ticket reference beneath it, a badge naming what raised or handled it, and how long ago it arrived.
AI Insights
A panel down the right, badged 'Powered by AI', holding a short written assessment of what the data shows. Each insight is a heading and a paragraph — for example a note that every ticket this week is less than a day old, or that SLA compliance is not being tracked. The panel footer carries the time it was last updated.
Work the dashboard each morning
- Sign in. The console opens on the Dashboard.
- Leave the filter on 'All Customers' for the overview, or pick one customer to work inside that account.
- Read the 'Ticket Health' cards: anything in 'Overdue Tickets' or 'SLA Expiring Soon' needs attention first.
- Click 'Unassigned Tickets' or 'View All Tickets' to pick work up.
- Read the 'AI Insights' panel for what has changed since yesterday.
- Raise anything new with '+ New Ticket'.
Note: the counts on this screen come from two sources. The ticket figures come from the service desk; the cards noted ‘ITSM data’ come from the device management side. They can be refreshed at different times, so they will not always agree to the second.