Event Search
- Click 'Security' > 'Endpoint Security' > 'EXDR' > 'Event Search' to open this interface.
Event Search runs a query over the events the security client recorded on your devices. You build the query from field names and operators, or start from one of the supplied sample queries, then set the period and run it.
You can assemble a query by clicking, type one by hand, limit it to a period, group the results, choose the columns and open any event to read its raw fields.
The query building panels
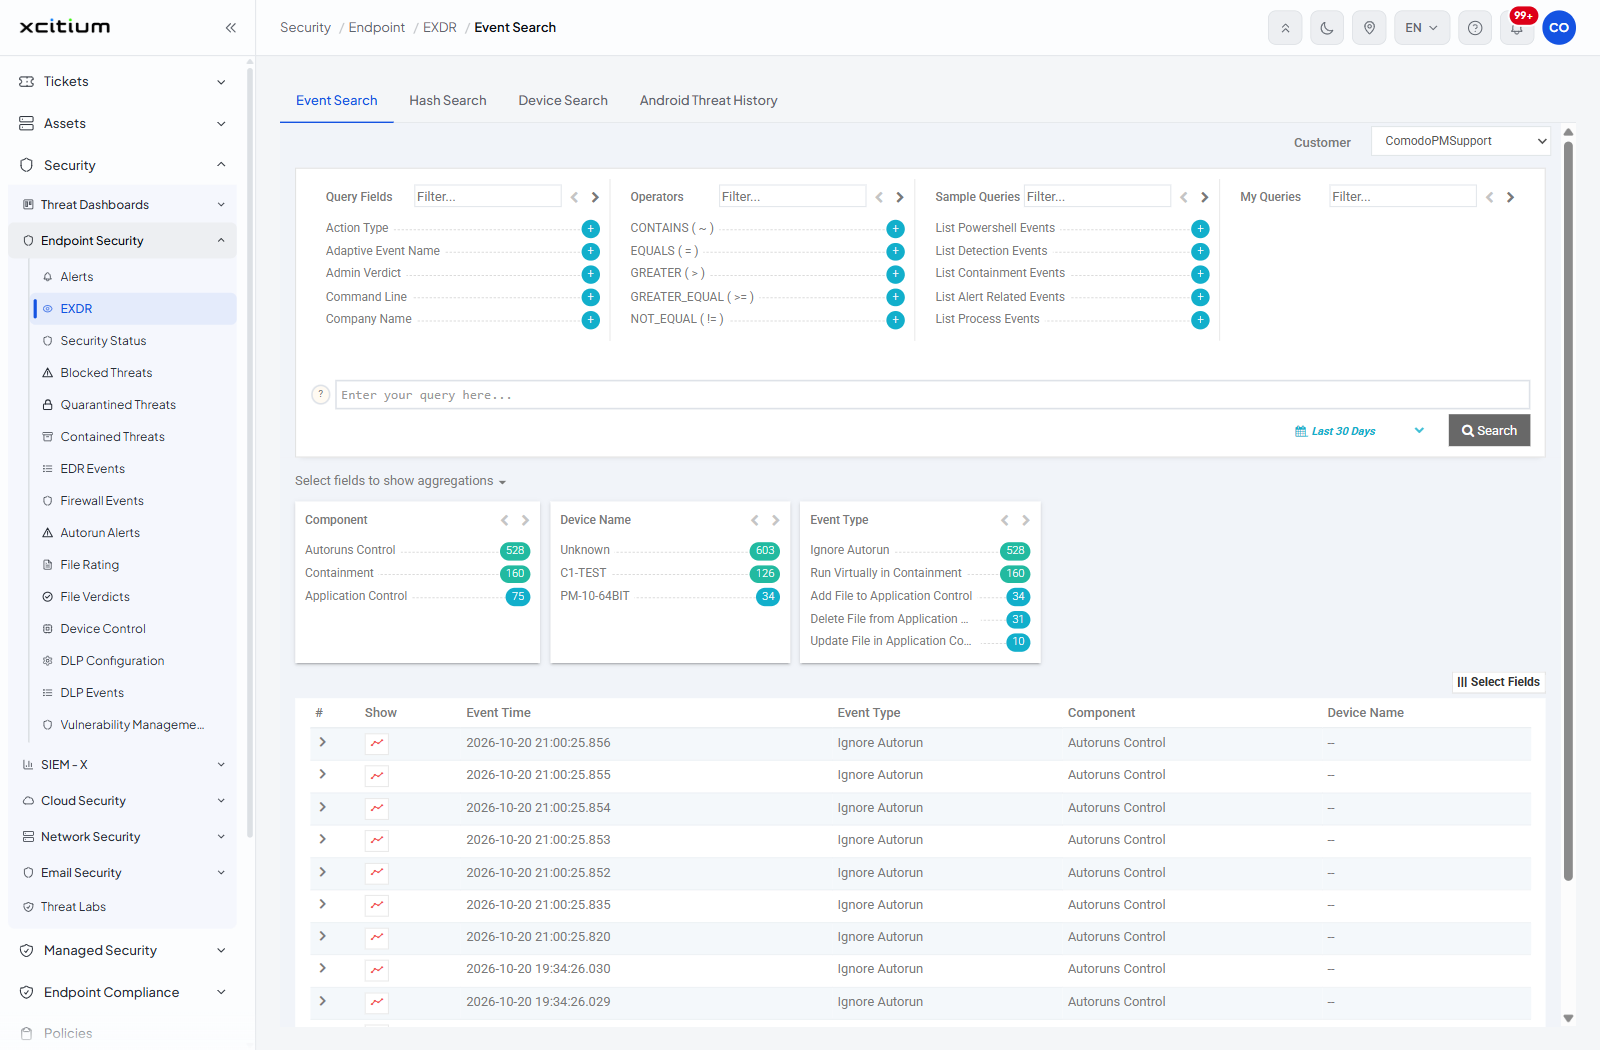
Four panels sit across the top. Each has a 'Filter...' box and a pair of arrows that page through its contents, and each entry carries a '+' button that drops it into the query box.
| Panel | Description |
| Query Fields | The 53 fields you can query on: Action Type, Adaptive Event Name, Admin Verdict, Command Line, Company Name, Component, Contained By, Containment Policy, Copyright, Destination IP, Destination Port, Device Name, Device OS, Downloaded File Hash, Downloaded File Path, Duplicate Count, Elevation Type, Event Group, Event Type, FLS Verdict, File Description, File Extension, File Hash, File Name, File Old Path, File Path, File Version, Hash, Logged On User, Network Transfer Protocol, Original Name, PID, Parent Process Creation Time, Parent Process FLS Verdict, Parent Process Hash, Parent Process Path, Parent Process User Domain, Parent Process User Name, Path, Process Instance ID, Process PID, Process User Domain, Process User Name, Product Name, Product Version, Registry Key Path, Registry Value Data, Registry Value Name, Signature, Source IP, Source Port, URL and Xcitium Verdict. |
| Operators | 'CONTAINS ( ~ )', 'EQUALS ( = )', 'GREATER ( > )', 'GREATER_EQUAL ( >= )', 'NOT_EQUAL ( != )', 'SMALLER ( < )' and 'SMALLER_EQUAL ( <= )'. |
| Sample Queries | Ready-made queries: 'List Powershell Events', 'List Detection Events', 'List Containment Events', 'List Alert Related Events', 'List Process Events', 'List File Events', 'List Registry Events', 'List Network Events' and 'List Defense Plus Events'. |
| My Queries | The queries you have saved yourself. |
Build and run a query
- Pick a customer in the 'Customer' list at the top right.
- Click '+' beside a field in 'Query Fields'. It is added to the query box, which carries the hint 'Enter your query here...'.
- Click '+' beside an operator in 'Operators', then type the value you are looking for.
- To combine conditions, repeat with 'AND' between them.
- Set the period using the date control to the right of the query box.
- Click 'Search'.
Start from a sample query
- Click '+' beside an entry in 'Sample Queries', for example 'List Powershell Events'.
- The query box fills with that query.
- Edit it if you want, then click 'Search'.
Read the query help
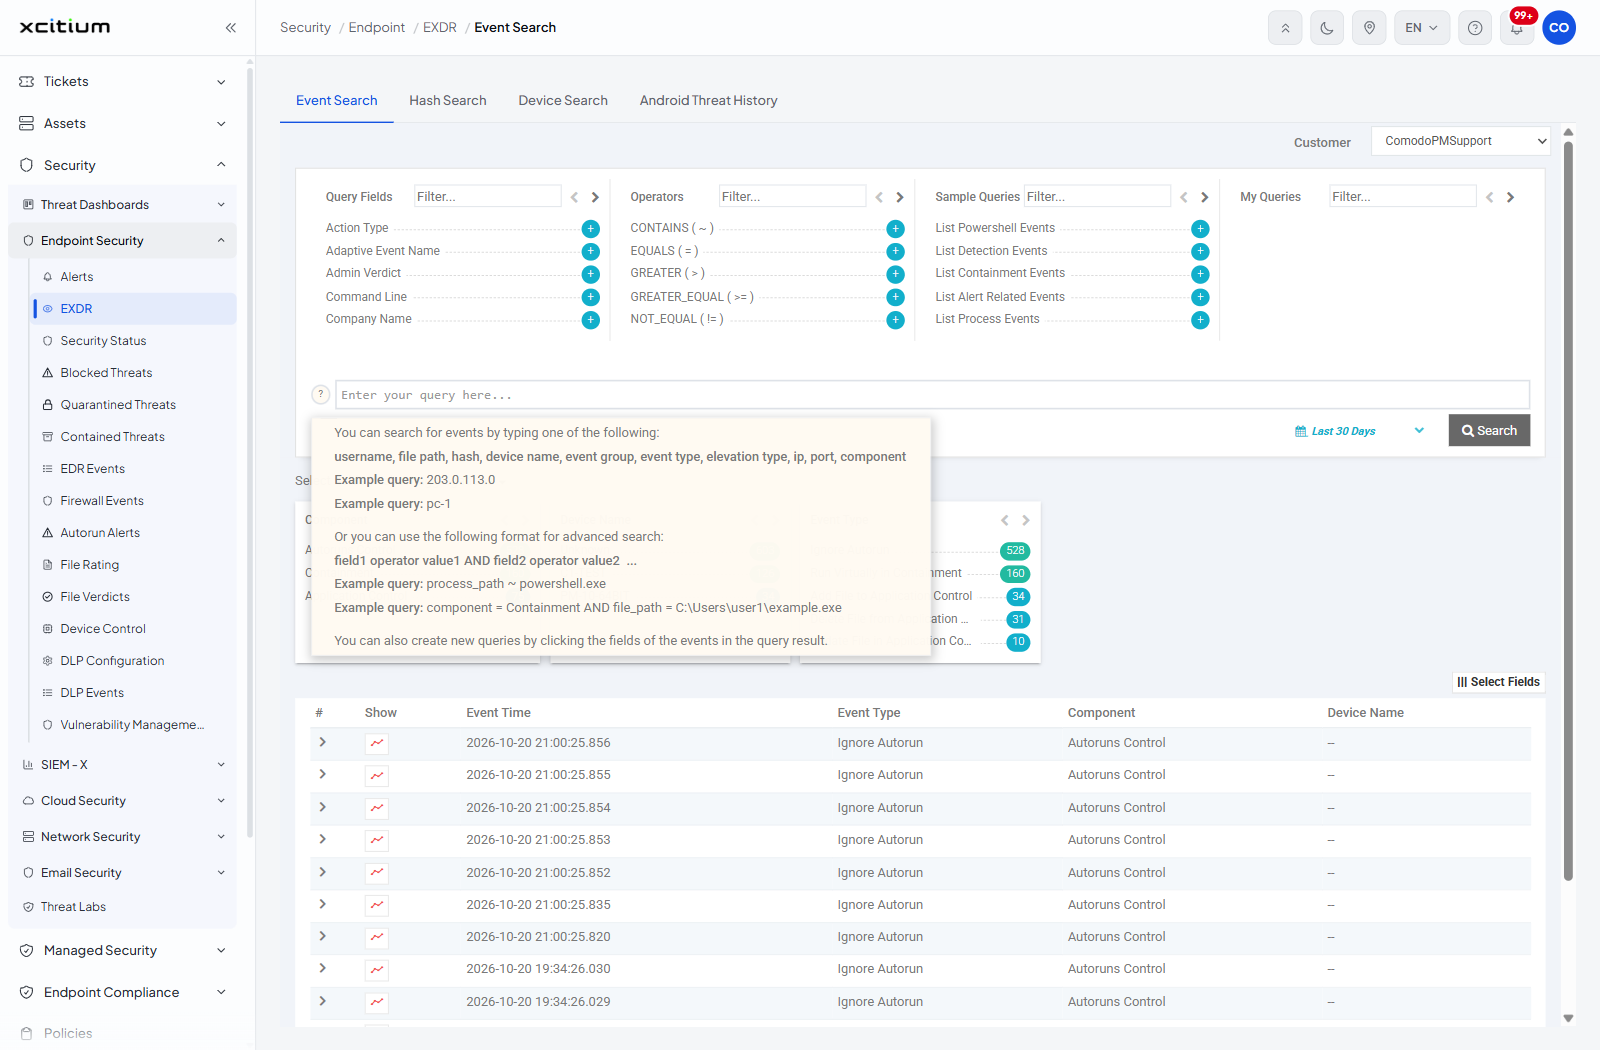
Click the '?' icon to the left of the query box. The help text reads:
- You can search for events by typing one of the following: username, file path, hash, device name, event group, event type, elevation type, ip, port, component.
- Example query: 203.0.113.0
- Example query: pc-1
- Or you can use the following format for advanced search: field1 operator value1 AND field2 operator value2 ...
- Example query: process_path ~ powershell.exe
- Example query: component = Containment AND file_path = C:Usersuser1example.exe
- You can also create new queries by clicking the fields of the events in the query result.
Set the period
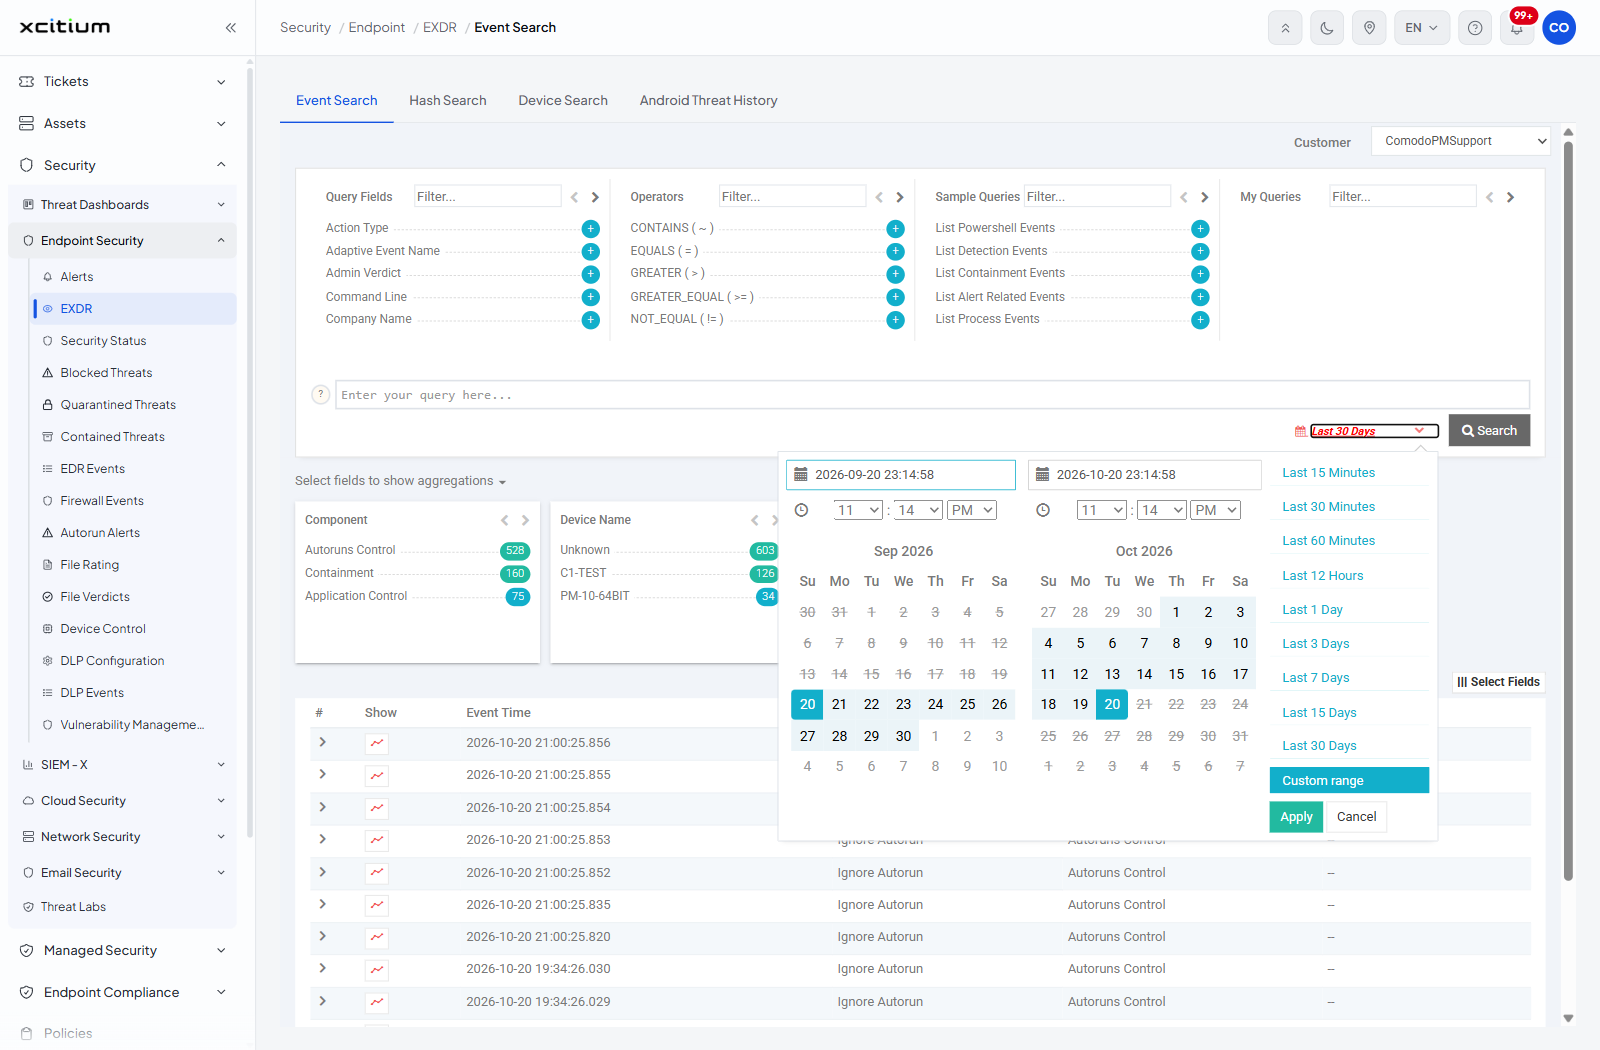
- Click the date control beside 'Search'. It reads 'Last 30 Days' until you change it.
- Pick a preset: 'Last 15 Minutes', 'Last 30 Minutes', 'Last 60 Minutes', 'Last 12 Hours', 'Last 1 Day', 'Last 3 Days', 'Last 7 Days', 'Last 15 Days', 'Last 30 Days' or 'Custom range'.
- For a custom range, set the two date boxes and the hour, minute and AM/PM lists beside them, or pick the days on the two calendars.
- Click 'Apply'. Click 'Cancel' to close the picker without changing anything.
The aggregation cards
Under the query box sits the 'Select fields to show aggregations' list. Pick the fields you want counted and the console draws a card for each one, showing the most common values with a count badge. Each card has its own pair of paging arrows.
The results table
| Column | Description |
| # | A chevron that expands the row to show the whole event. |
| Show | A small chart icon for the event. |
| Event Time | When the event was recorded, to the millisecond. |
| Event Type | What happened, for example 'Ignore Autorun' or 'Run Virtually in Containment'. |
| Component | The part of the client that recorded it. |
| Device Name | The device the event came from. |
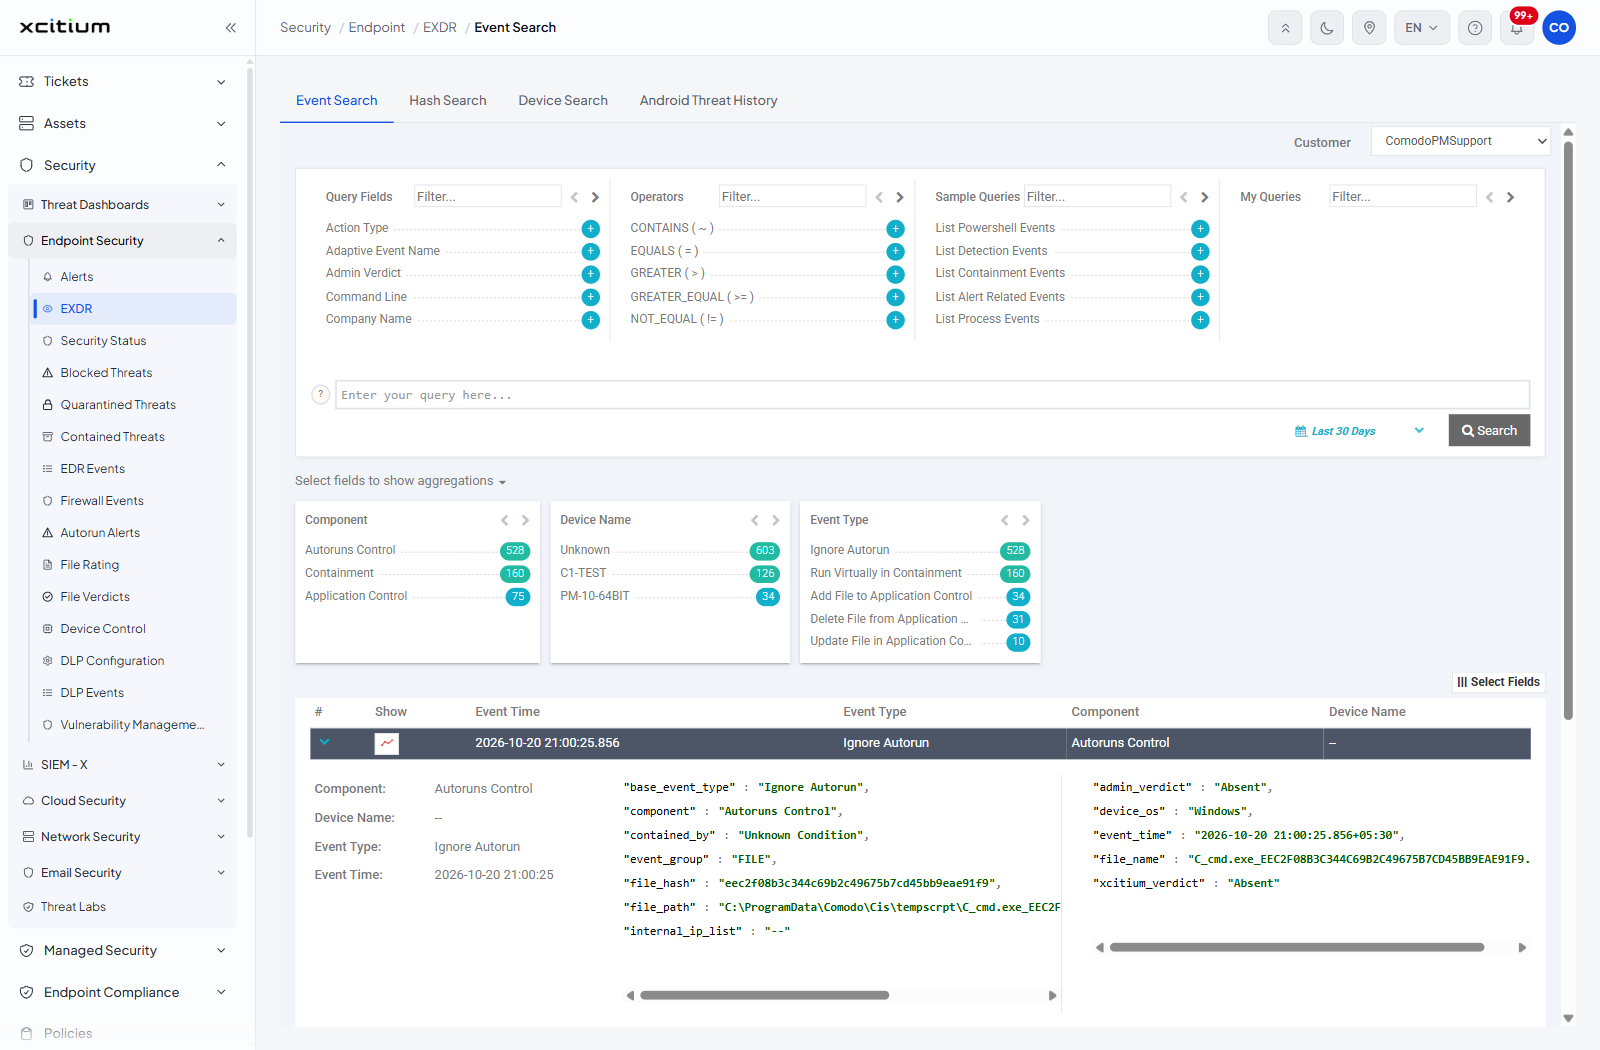
Open one event in full
- Click the chevron in the '#' column of the row you want.
- The row expands. On the left is a summary with 'Component:', 'Device Name:', 'Event Type:' and 'Event Time:'.
- Beside it the raw event fields are listed as name and value pairs, for example 'base_event_type', 'component', 'contained_by', 'event_group', 'file_hash', 'file_path', 'internal_ip_list', 'admin_verdict', 'device_os', 'event_time', 'file_name' and 'xcitium_verdict'. Both columns scroll sideways when a value is long.
- Click the chevron again to collapse the row.