


The Query Library
- Click 'Assets' > 'Endpoint Intelligence' > 'Query Library' to open this interface.
The library is a set of ready-made queries covering the questions administrators ask most often, from the operating system version to the processes that are burning the most processor time.
You can run a library query as it stands, read its SQL first, or turn it straight into a monitor.
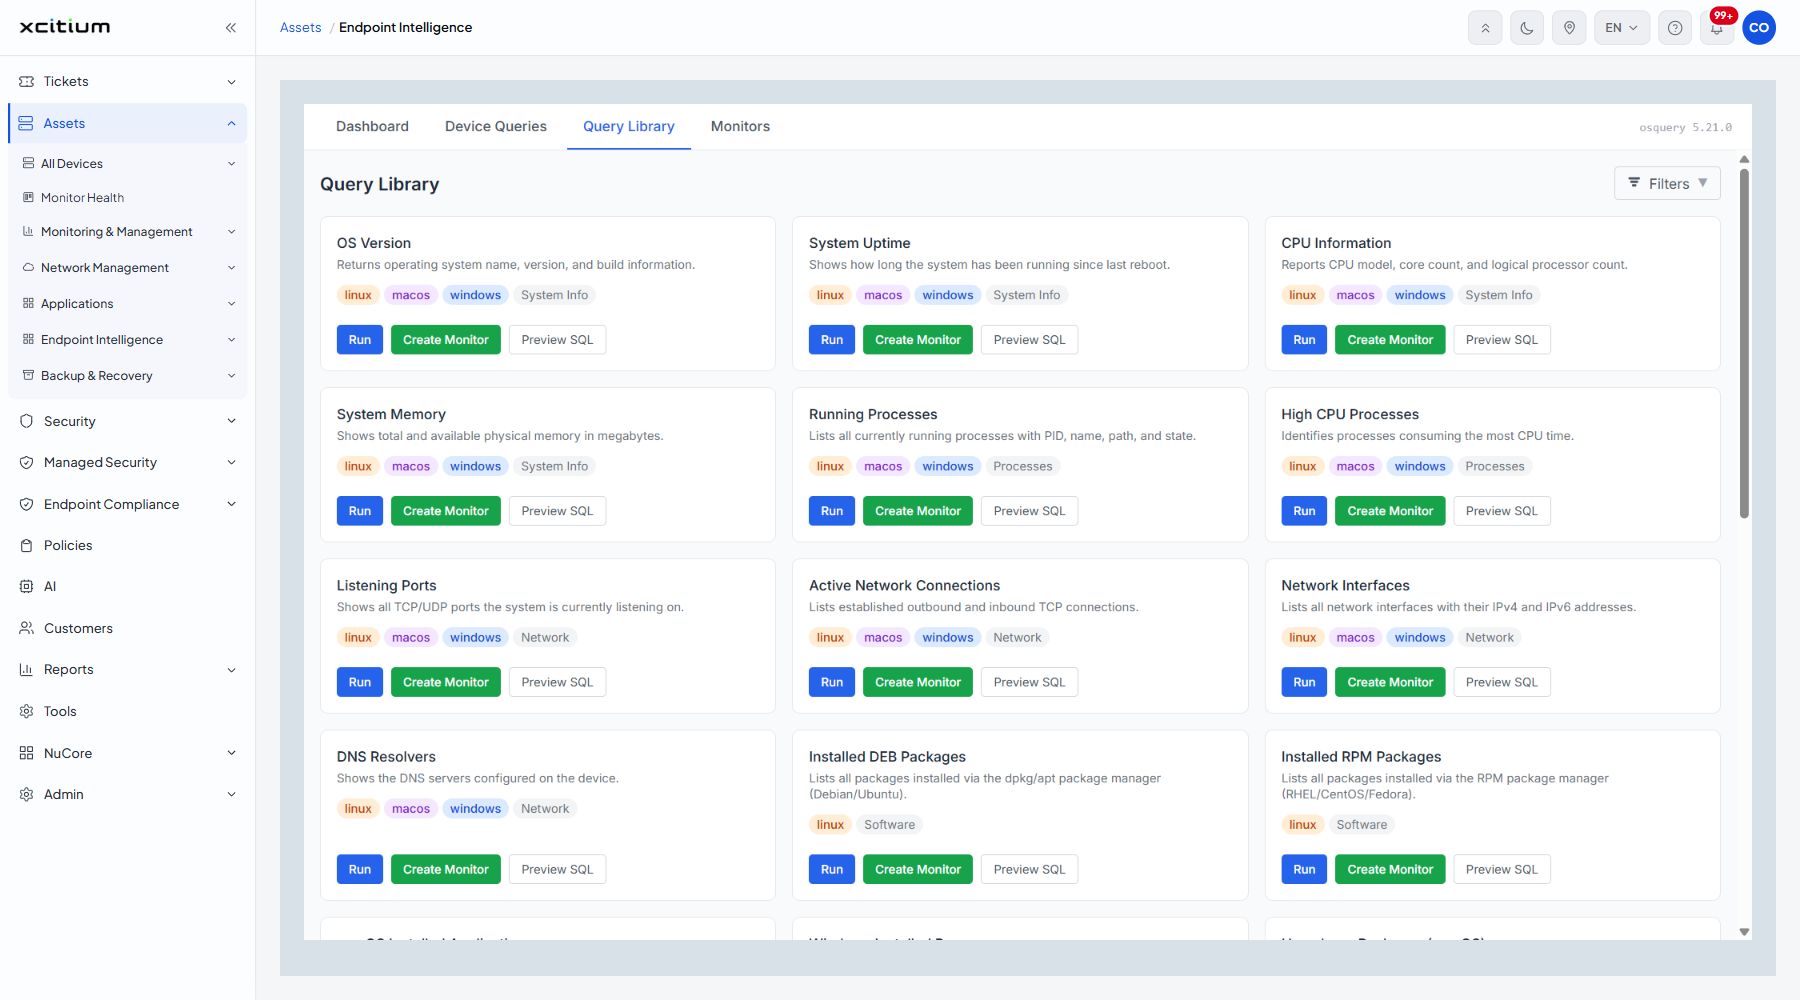
A query card
Each card carries a title, a one-line description, platform tags and a category tag, and three buttons:
| Button | Description |
| Run | Sends the query to your devices now. |
| Create Monitor | Opens the Create Monitor form with this query already filled in. |
| Preview SQL | Opens the SQL in a read-only dialog. |
The queries in the library
The library holds 23 queries, grouped by category:
| Category | Queries |
| System Info | OS Version — name, version and build. System Uptime — how long since the last reboot. CPU Information — model, core count and logical processor count. System Memory — total and available physical memory. |
| Processes | Running Processes — every process with its PID, name, path and state. High CPU Processes — the processes using the most processor time. |
| Network | Listening Ports — the TCP and UDP ports the device listens on. Active Network Connections — established inbound and outbound TCP connections. Network Interfaces — every interface with its IPv4 and IPv6 addresses. DNS Resolvers — the configured DNS servers. |
| Software | Installed DEB Packages (Linux). Installed RPM Packages (Linux). macOS Installed Applications. Windows Installed Programs. Homebrew Packages (macOS). |
| Users | Local User Accounts. Currently Logged-in Users. |
| Security | SUID/SGID Binaries. |
| File System | Disk Mounts. |
| Hardware | Hardware System Info — manufacturer, product name and serial number. |
| Scheduling | Scheduled Tasks (Windows). Startup Items (macOS). Cron Jobs. |
The Preview SQL dialog
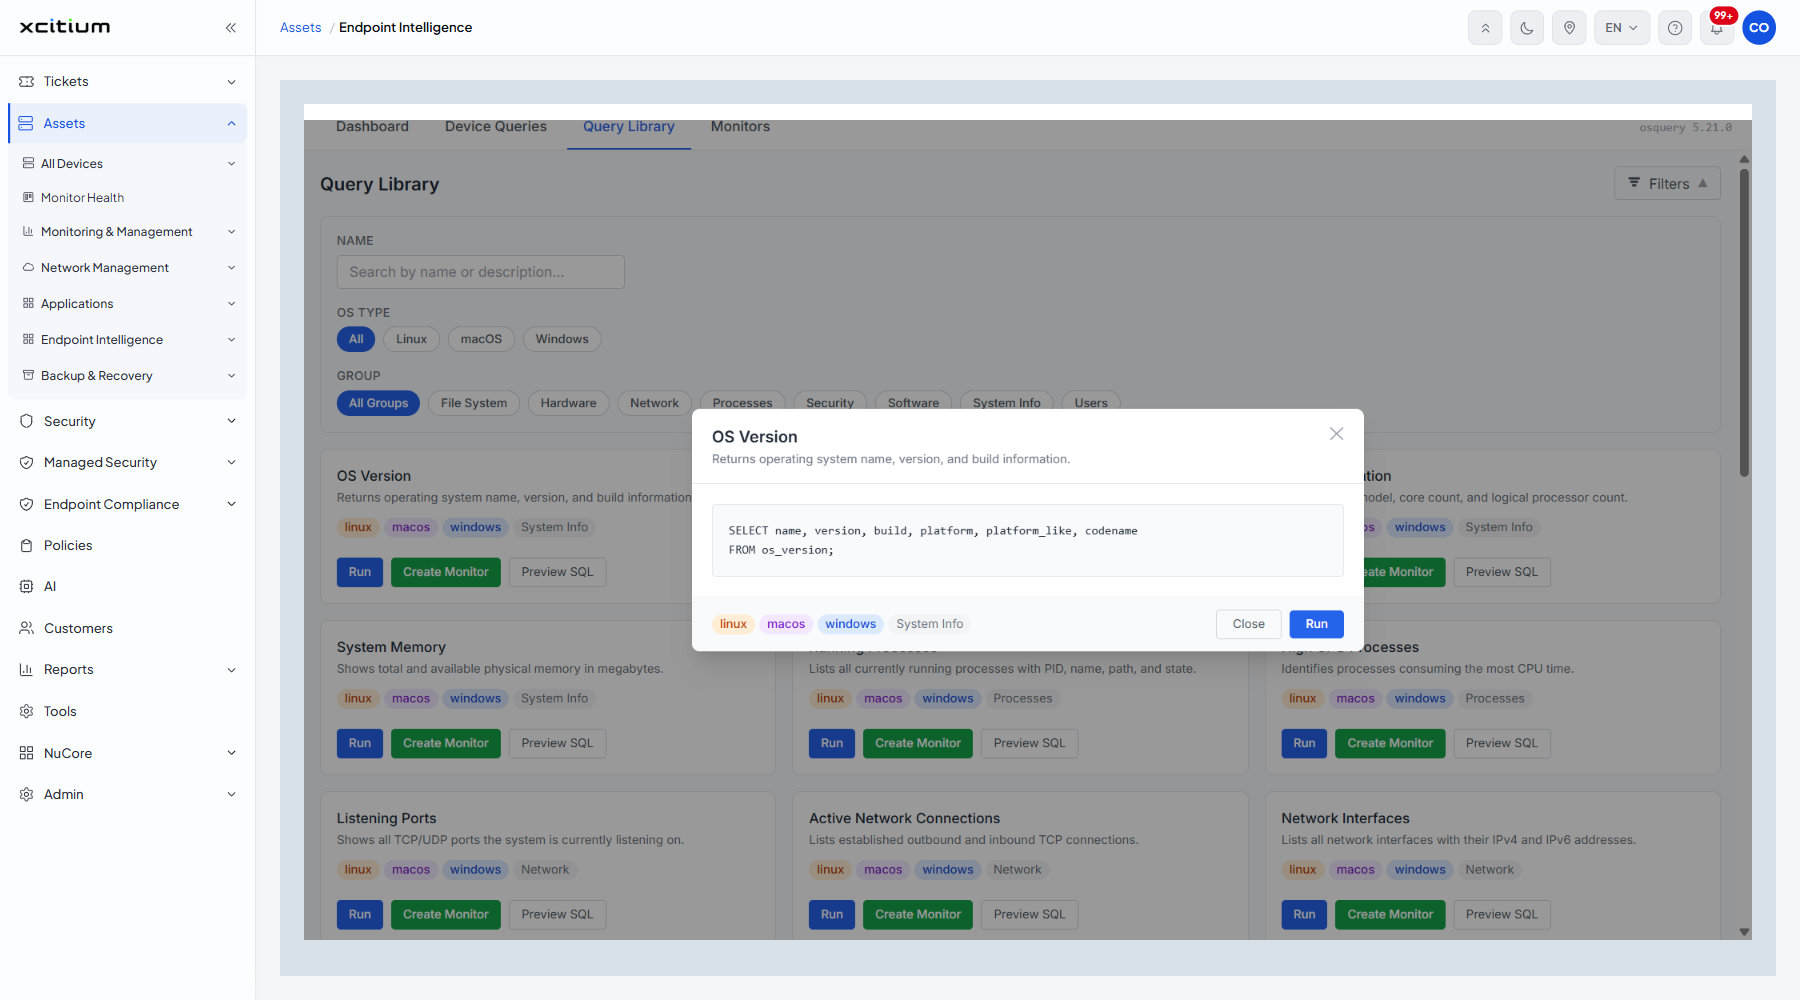
The dialog shows the query name, its description, the SQL in a read-only code box, and its platform and category tags. Two buttons sit at the bottom:
| Button | Description |
| Close | Closes the dialog without running anything. |
| Run | Runs the query. |
The Filters dropdown
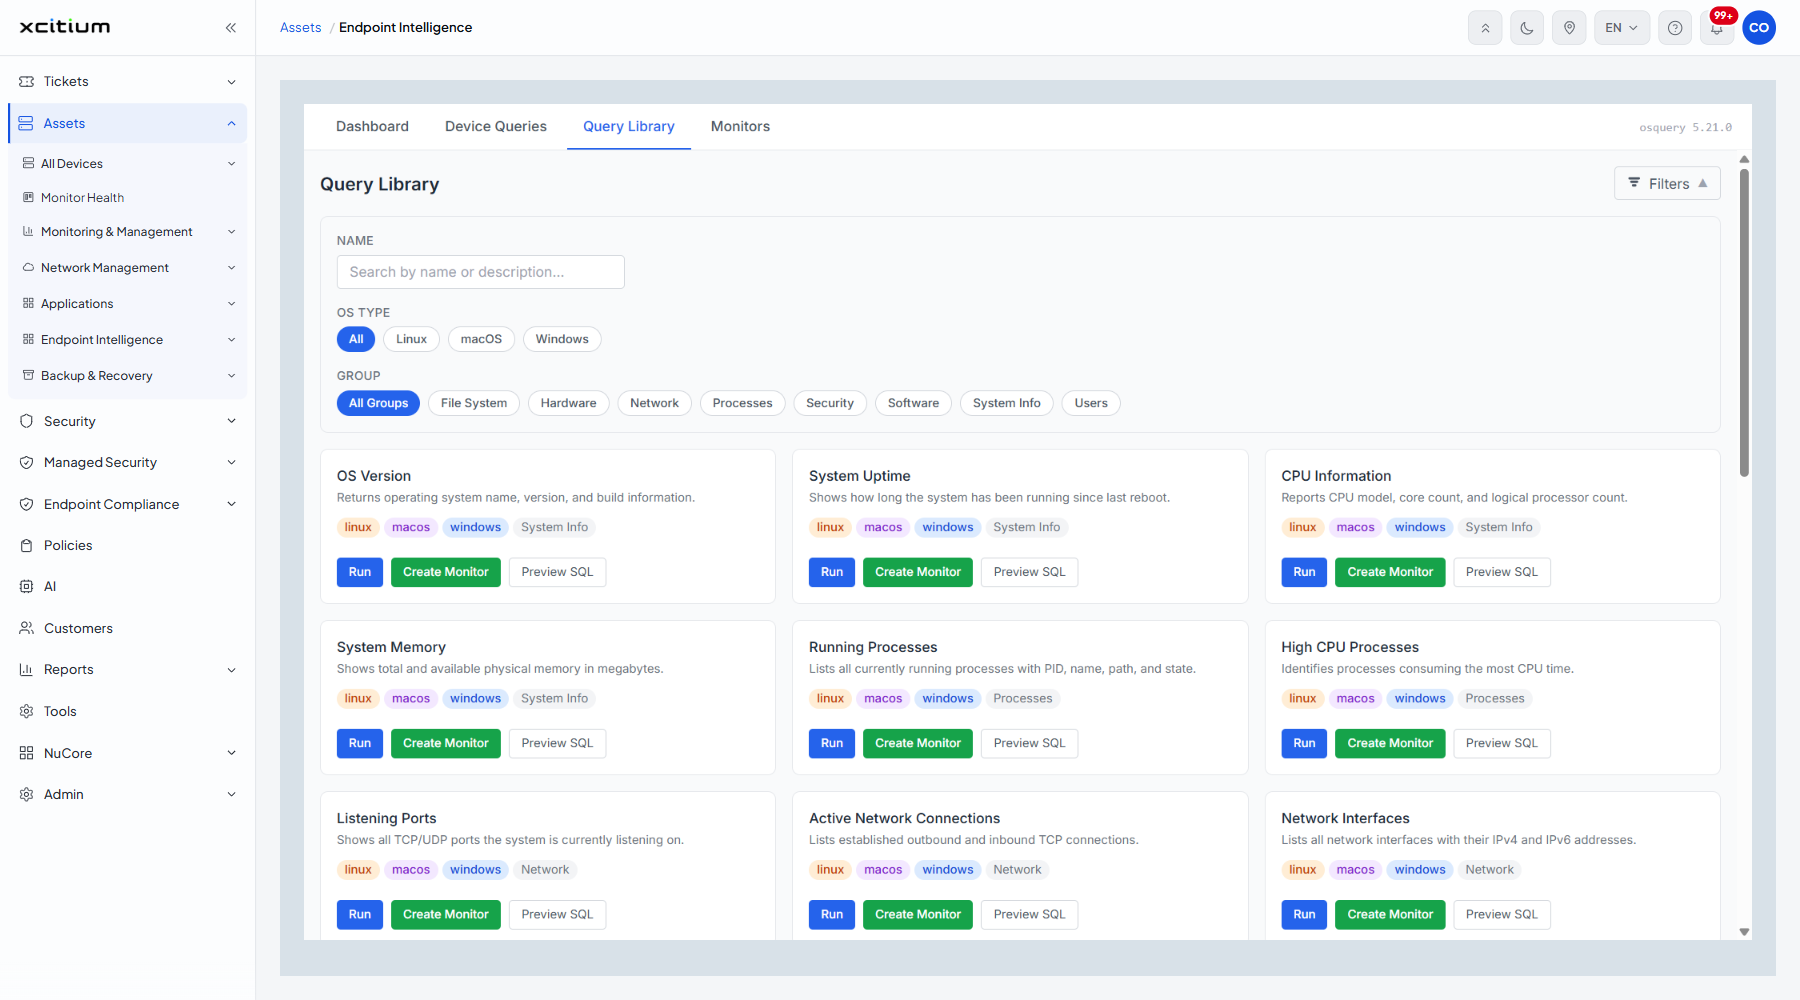
| Field | Type | Options / default | Required |
| NAME | Search box | Empty by default, with the placeholder 'Search by name or description...'. | No |
| OS TYPE | Buttons | 'All' (default), 'Linux', 'macOS', 'Windows'. | No |
| GROUP | Buttons | 'All Groups' (default), 'File System', 'Hardware', 'Network', 'Processes', 'Security', 'Software', 'System Info', 'Users'. | No |
Turn a library query into a monitor
- Click 'Assets' > 'Endpoint Intelligence' > 'Query Library'.
- Click 'Filters' and narrow the cards by platform or category if the list is long.
- Click 'Preview SQL' on the card to check what the query does, then click 'Close'.
- Click 'Create Monitor' on that card.
- The Create Monitor form opens with the SQL already in place. Set the schedule, the pass condition and the target.
- Click 'Save Monitor'.
Note: 'Run' on a card and 'Run' in the Preview SQL dialog both dispatch the query to live endpoints.