


SLA Reports
- Click 'Reports' > 'SLA Reports' to open this interface.
'SLA Reports' opens the service desk reporting console and lands on its 'Report' screen. The screen shows how many tickets were created, reopened and closed over a period, as a chart, four running totals and a day-by-day table. Use it to see whether your queues are keeping up.
You can narrow the report to a single help topic, set the start and end dates, switch the chart between day, week and month grouping, run the report again, and produce it as a PDF.
The Interface
The console carries its own menu down the left and its own menu bar across the top; both belong to the service desk, not to the platform. The report area fills the rest.
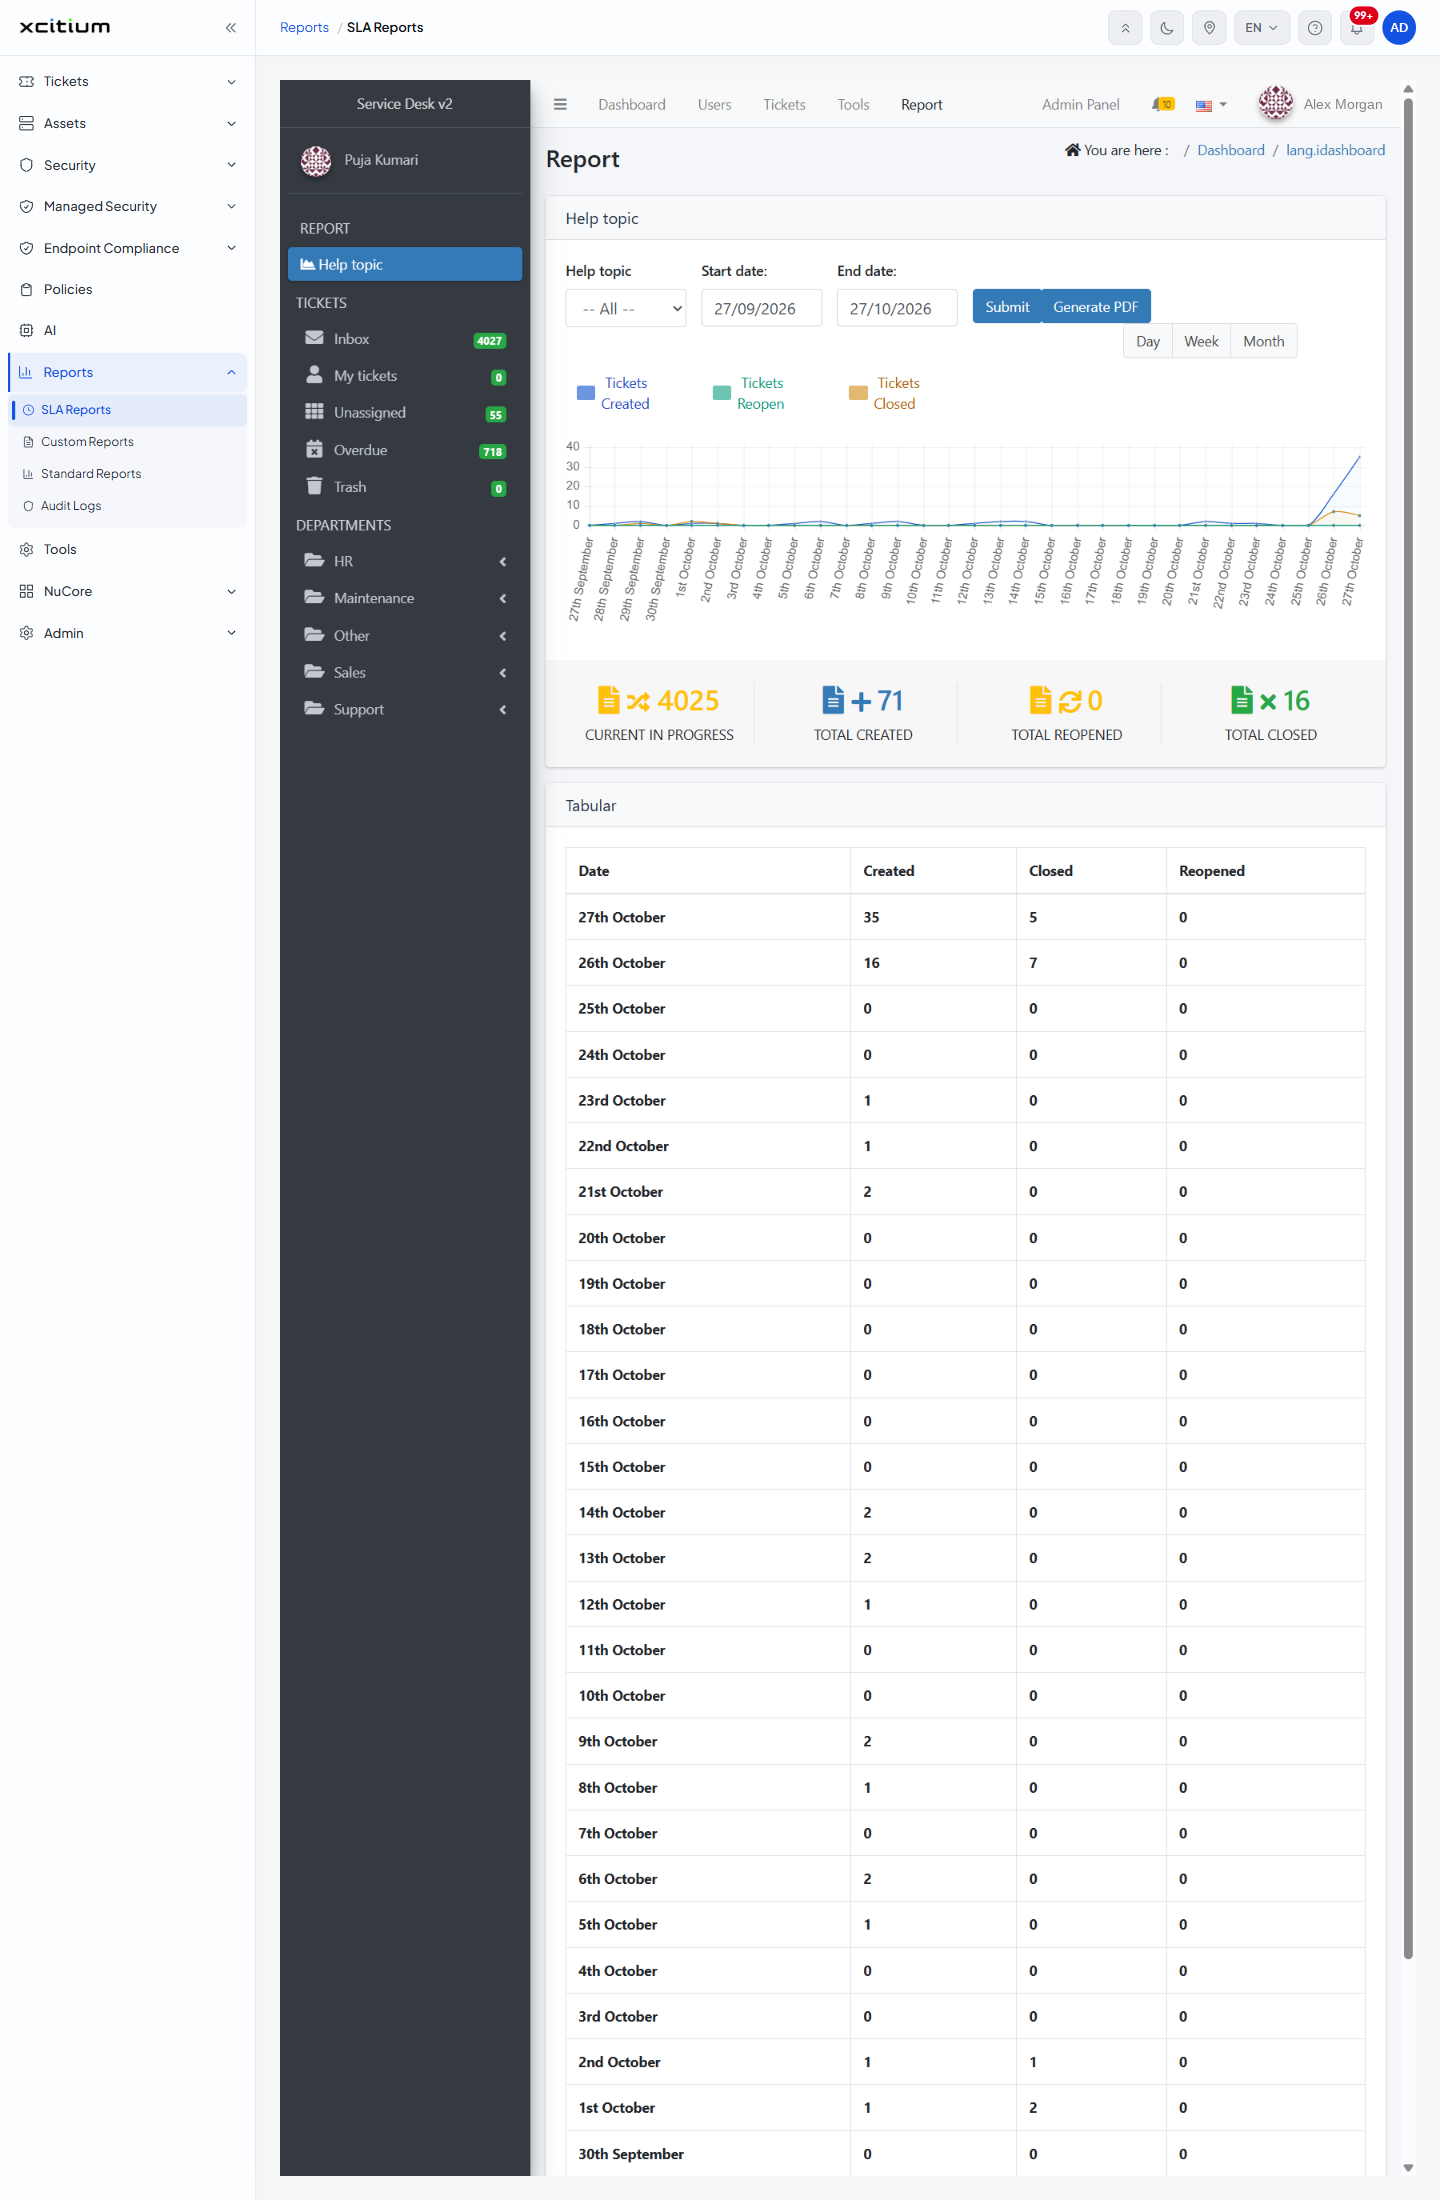
| Part of the screen | Description |
| Console title and user | 'Service Desk v2' with your name and avatar beneath it, at the top of the left menu. |
| REPORT | The report list. 'Help topic' is the only entry and is selected when the page opens. |
| TICKETS | Shortcuts into the ticket queues with a live count on each: 'Inbox', 'My tickets', 'Unassigned', 'Overdue' and 'Trash'. |
| DEPARTMENTS | One expandable entry per department — for example 'HR', 'Maintenance', 'Other', 'Sales' and 'Support'. Click the chevron to open a department. |
| Top menu bar | 'Dashboard', 'Users', 'Tickets', 'Tools' and 'Report', with 'Admin Panel', a notification count, a language selector and your name on the right. 'Report' is the one in use here. |
| 'You are here' trail | The console's own breadcrumb, to the right of the 'Report' heading. |
The 'Help topic' Filter Bar
| Control | Description | Options / default |
| Help topic | Drop-down | '-- All --' (the default) and one entry per help topic configured on the service desk, for example 'Support query'. |
| Start date: | Date box | Defaults to one month before today, written dd/mm/yyyy. |
| End date: | Date box | Defaults to today, written dd/mm/yyyy. |
| Submit | Button | Runs the report again with the dates and help topic you have set, and redraws the chart, the totals and the table. |
| Generate PDF | Button | Produces the report as a PDF document. |
| Day / Week / Month | Three linked buttons under 'Submit' | Set how the chart groups the period. The button you pick is highlighted. 'Submit' clears the choice. |
The Chart
A line chart with one date along the bottom for each day in the period and the ticket count up the side. Three series are keyed above it:
- Tickets Created
- Tickets Reopen
- Tickets Closed
The Totals
| Total | Description |
| CURRENT IN PROGRESS | Tickets open right now. This count is not limited to the period. |
| TOTAL CREATED | Tickets raised during the period. |
| TOTAL REOPENED | Tickets reopened during the period. |
| TOTAL CLOSED | Tickets closed during the period. |
The 'Tabular' Table
Below the chart, the same figures are listed one row per day, newest first. There is no paging; the table runs the whole length of the period.
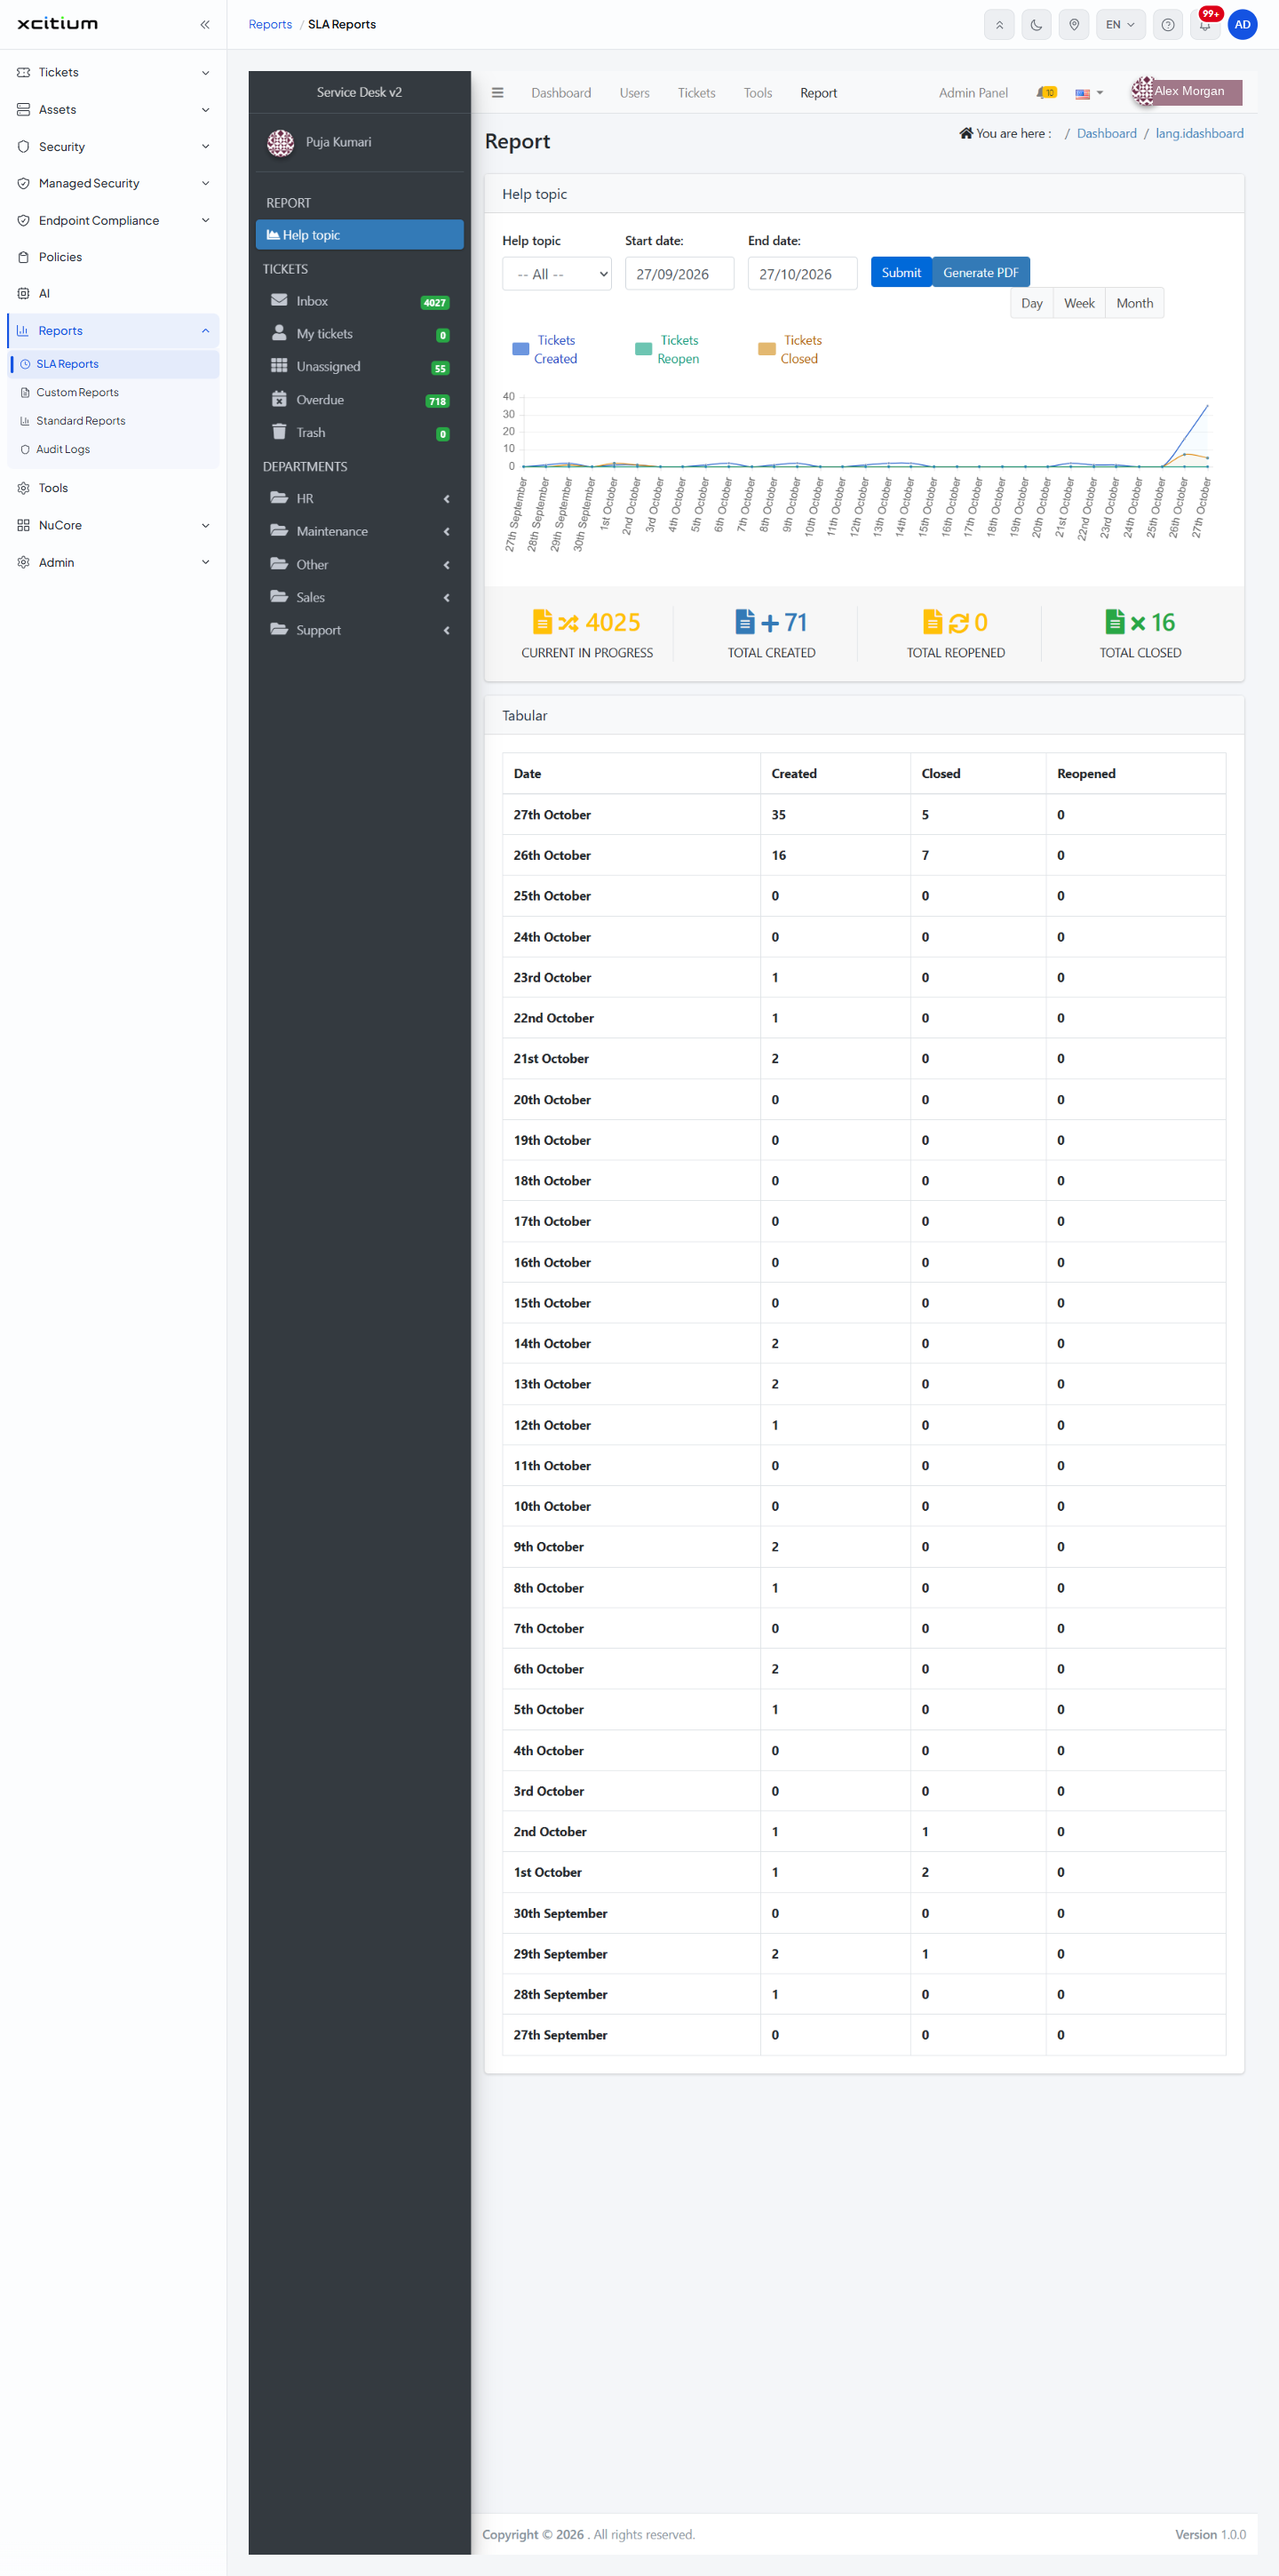
| Column | Description |
| Date | The day, written as an ordinal and a month, for example '27th October'. |
| Created | Tickets raised that day. |
| Closed | Tickets closed that day. |
| Reopened | Tickets reopened that day. |
Run an SLA Report
- Click 'Reports' > 'SLA Reports'. The console opens on 'Report' with 'Help topic' selected.
- Choose a help topic, or leave 'Help topic' on '-- All --' to cover every queue.
- Set 'Start date:' and 'End date:'.
- Click 'Submit'. The chart, the four totals and the 'Tabular' table redraw.
- Scroll down inside the console panel to read the day-by-day table.
Produce the Report as a PDF
- Set the help topic and dates and click 'Submit'.
- Click 'Generate PDF'.
Note: the console has its own scrollbar. Scroll inside the panel to reach the chart's totals and the table; scrolling the browser window moves the platform page instead.
Note: the ticket queues and departments in the console's left menu belong to the service desk. Use the platform's own 'Tickets' section for day-to-day ticket work.