


View Execution Details of a Run
- Open a procedure's 'Execution Log' tab, then click 'Details' on the run you want.
The detail view replaces the log and shows the full status history of that single run, plus any service desk tickets the run raised.
You can read the run's timeline, see any message the endpoint returned, and go back to the log.
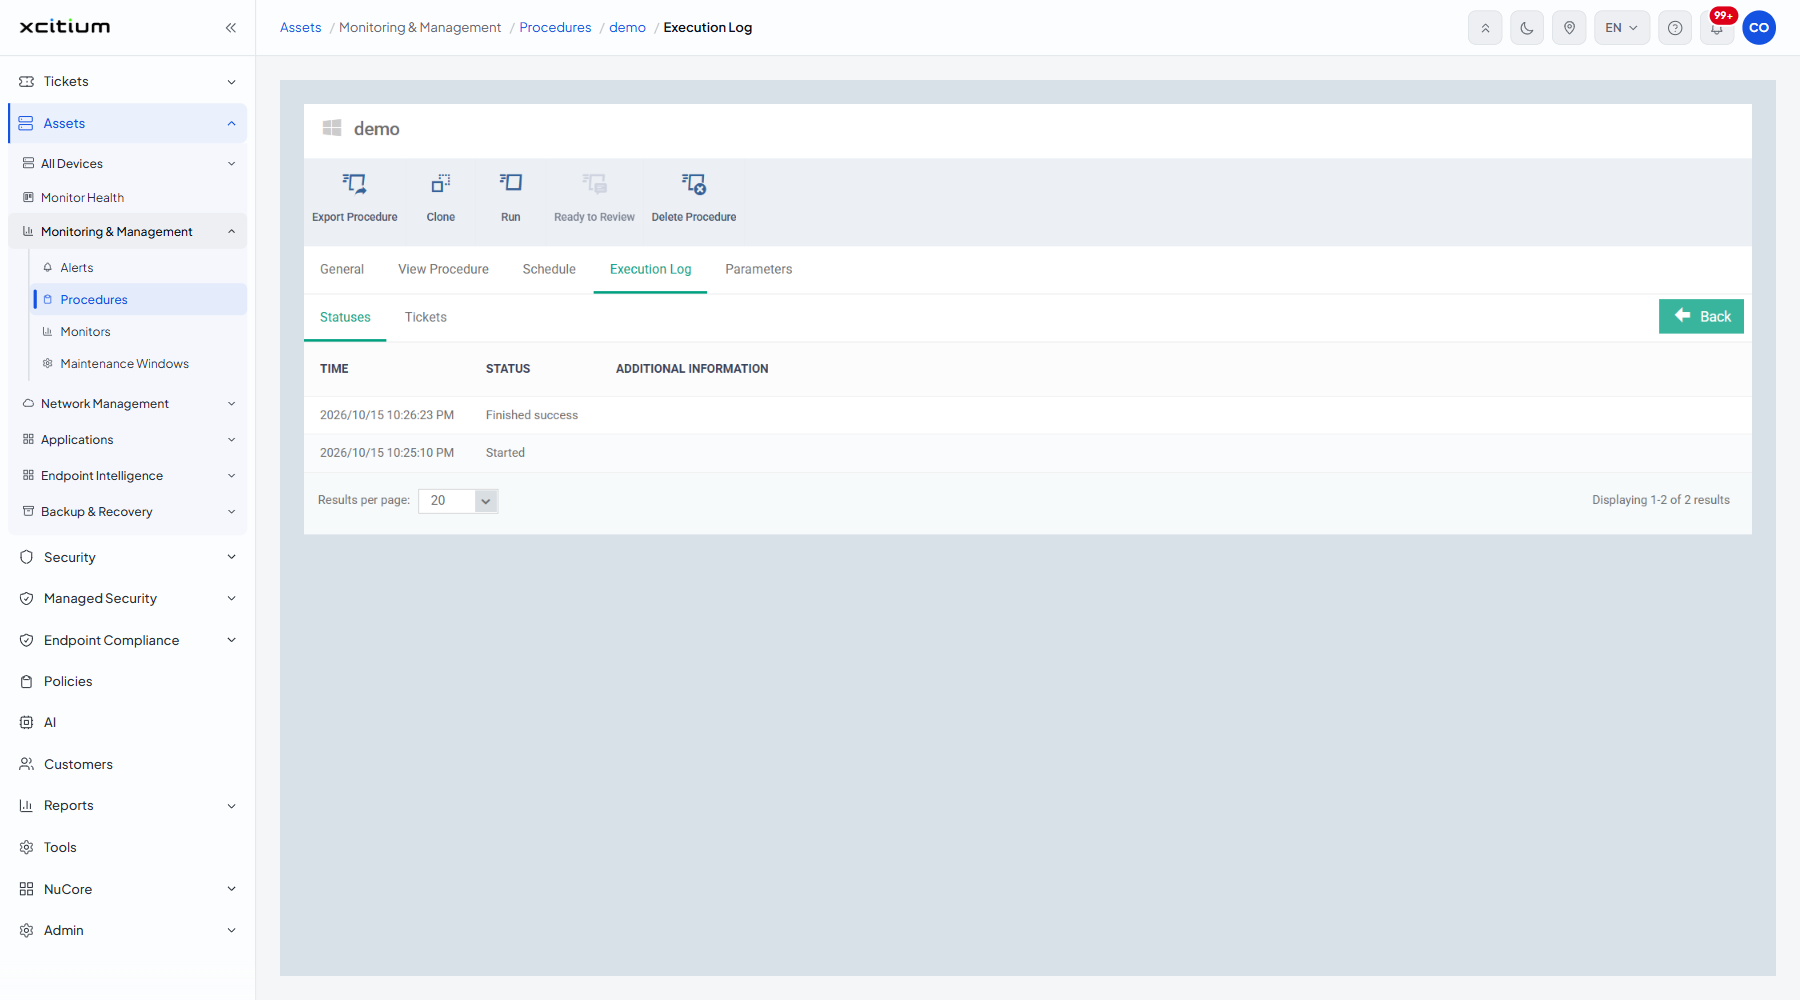
A 'Back' button returns you to the Execution Log. Two tabs sit below it:
- Statuses — the timeline of the run. This is the default.
- Tickets — the service desk tickets the run raised.
The Statuses tab
| Column | Description |
| Time | When the status was recorded. |
| Status | What happened at that moment. Values seen: 'Started', 'Finished success'. |
| Additional information | Any message the endpoint returned, such as the reason a run failed. |
The Tickets tab
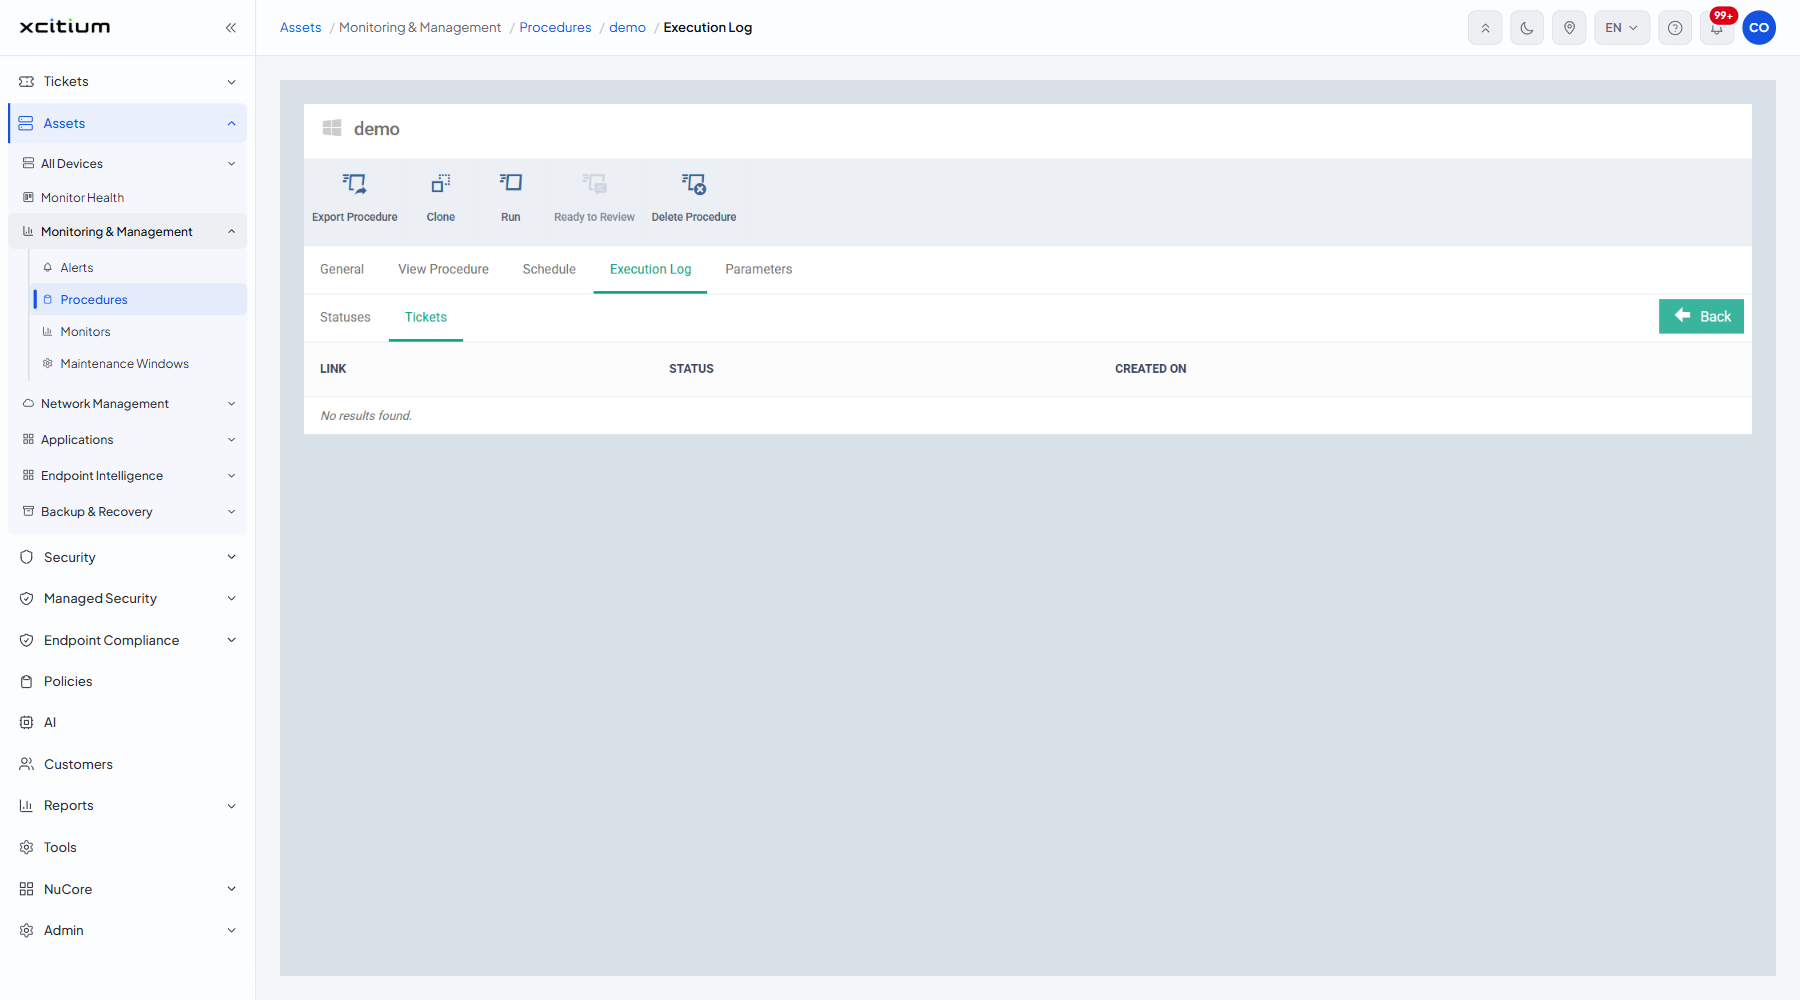
| Column | Description |
| Link | A link to the ticket the run raised. |
| Status | The state of that ticket. |
| Created on | When the ticket was raised. |
Where a run raised no ticket the tab reads 'No results found.'
Read the detail of a run
- Open the procedure and click the 'Execution Log' tab.
- Click 'Details' on the row you are interested in.
- Read the timeline on 'Statuses'; check 'Additional information' for the reason a run failed.
- Open 'Tickets' to see whether the run raised a ticket.
- Click 'Back' to return to the log.