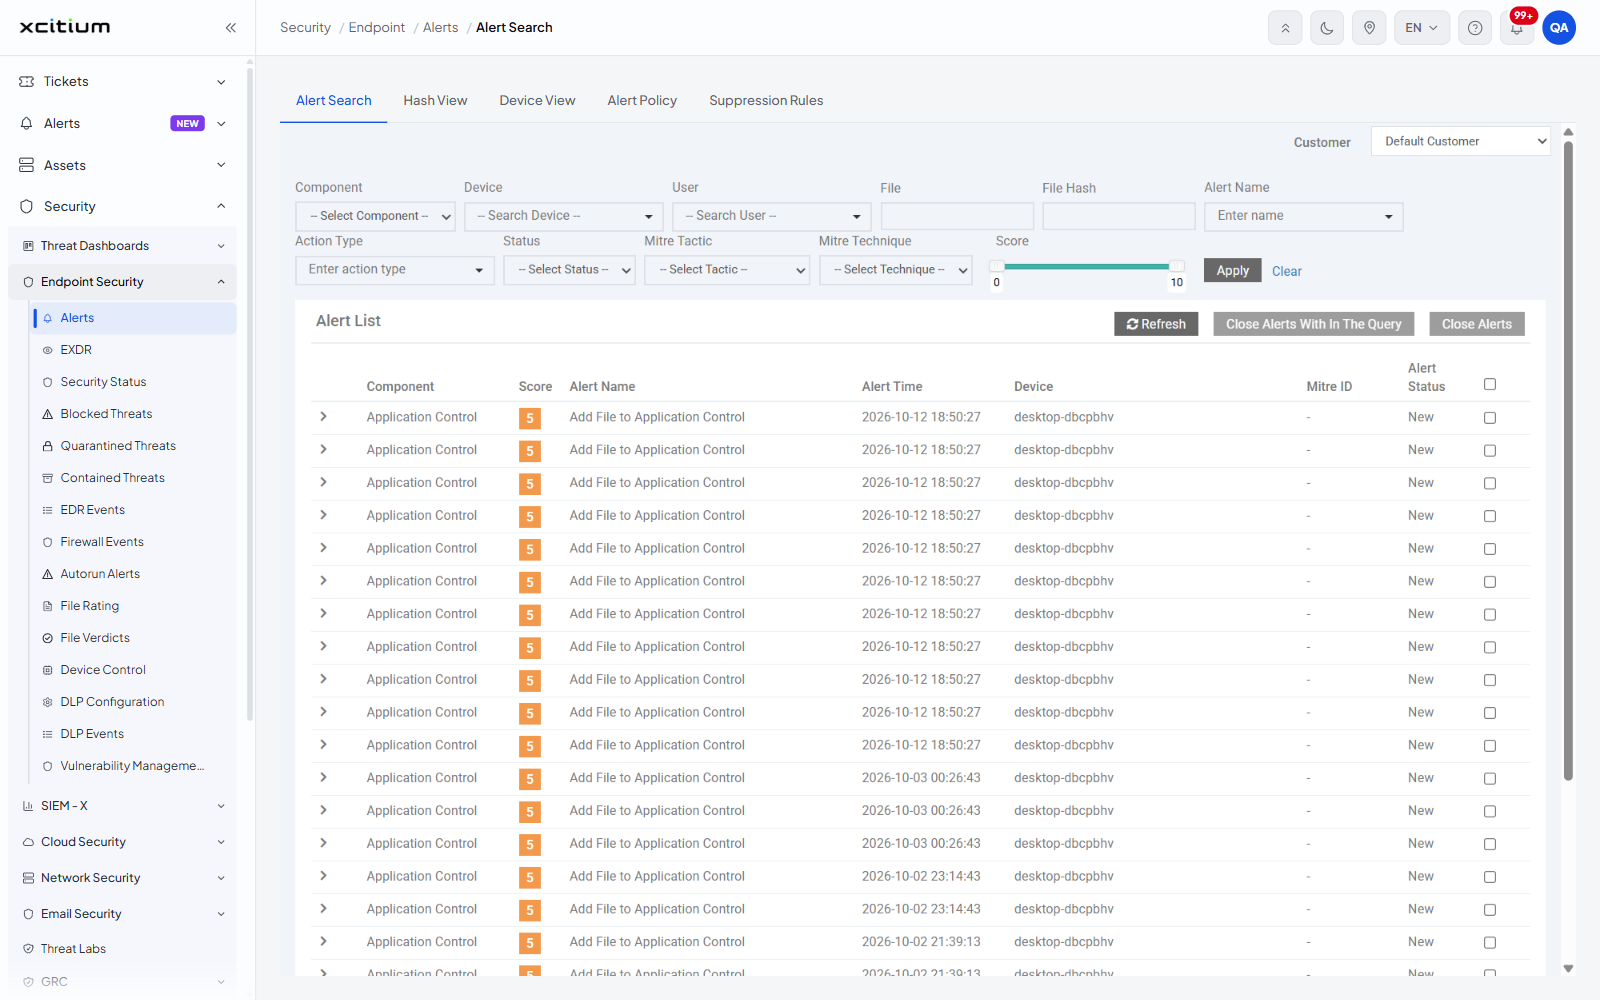
Alerts
- Click 'Security' > 'Endpoint Security' > 'Alerts' to open this interface.
The 'Alerts' interface collects the security alerts that your endpoint protection components raise on managed devices. An alert is generated when a component such as Antivirus, Containment or Application Control reports an event that matches an alert policy. Each alert carries a score, a MITRE ATT&CK reference where one applies, the device it came from, and a status of 'New' or 'Closed'.
You can search the alerts of a customer, pivot the same data by file hash or by device, review the policies that decide which events become alerts, and review the rules that suppress alerts you do not want to see.
The tabs
The interface has five tabs along the top of the page:
| Tab | Description |
| Alert Search | The default tab. A filter bar and the 'Alert List' of individual alerts, one row per alert, with an expandable detail panel on each row. See Alert Search. |
| Hash View | The same alerts grouped by file hash, so you see one row per file rather than one row per alert. See Hash View. |
| Device View | The same alerts grouped by device, so you see one row per device. See Device View. |
| Alert Policy | The alert policies that decide which events raise an alert, and how they are scored. See Alert Policy. |
| Suppression Rules | The rules that stop matching events from raising alerts. See Suppression Rules. |
Open the Alerts interface
- Click 'Security' in the left navigation bar.
- Click 'Endpoint Security' to expand the group.
- Click 'Alerts'. The interface opens on the 'Alert Search' tab, and the breadcrumb at the top of the page reads 'Security / Endpoint / Alerts / Alert Search'.
- Click any of the five tabs to change view.
Note: every tab is scoped to a single customer. The 'Customer' control sits at the top right of the page and carries over as you move between tabs, so check it before you read any figure.