


- Introduction
- Tickets
- Assets
- All Devices
- Device List
- Filter The Device List
- Group Management
- Enroll A Device
- Device Details
- View And Edit The Device Name
- View Device Summary Information
- View Network Information
- View Policies Associated With A Device
- View Applications Installed On A Device
- View The Command Queue
- View MSI Installation State
- View And Manage Patches On A Device
- View A Device's Groups
- View Device Logs
- Manage A Device's Policies
- Run A Procedure On A Device
- Install And Manage Packages On A Device
- Reboot Or Shut Down A Device
- Collect Performance Logs
- Change A Device's Owner
- Delete A Device
- Bulk Installation Package
- Device List
- Monitor Health
- Monitoring And Management
- Alerts
- Procedures
- Monitors
- Filter The Monitors List
- Create A Monitor
- A Monitor's General Tab
- A Monitor's Conditions Tab
- Add A Performance Condition
- Add A File Size Condition
- Add A Folder Size Condition
- Add A Disk Condition
- Add A Service Condition
- Add A Process Condition
- Add An Event Condition
- Add A TCP Condition
- Add A Ping Condition
- Add A Web Page Condition
- Add A Device Status Condition
- Add A Custom Script Condition
- Add A Security Events Condition
- Add A Security Client Events Condition
- Add An OS Patches Event Condition
- A Monitor's Policies Tab
- A Monitor's Logs Tab
- Clone, Import, Export And Delete Monitors
- Maintenance Windows
- Network Management
- Applications
- Endpoint Intelligence
- All Devices
- Security
- Threat Dashboards
- Endpoint Security
- SIEM - X
- Cloud Security
- Network Security
- Email Security
- Threat Labs
- Managed Security
- Endpoint Compliance
- Work With Endpoint Compliance Lists
- Agents
- All Assets
- Other Assets
- Deprecated Assets
- Problems
- Solutions
- Pending OS Patches
- Ports
- Patch Management
- Application Baseline Results
- Certificates
- Vulnerabilities
- Application Vulnerabilities
- Vulnerability By OS
- OS Vulnerabilities
- Network Scan Findings
- Compliance Standards
- Compliance Assessment
- Compliance Check Master
- Discovery Settings And Credentials
- Manage Mapping
- Jobs
- Alerts
- Policies
- The Profile List
- Policy Configuration
- Default Policies
- Predefined Policies
- The Policy Editor
- The Profile Editor
- Sections Configuration
- Add And Remove Profile Sections
- Profile Sections On Other Operating Systems
- General (Windows Profile)
- Associated Devices (Windows Profile)
- Profile Health Check
- Client Updates
- EXDR Updates
- Remote Control
- Client UI Settings
- Client Rebranding
- Client Proxy
- Client Access Control
- Remote Tools
- Monitors
- Procedures
- Patch Management
- Maintenance Window
- Global Proxy
- Client Logging Settings
- Antivirus
- Firewall
- EDR
- File Rating
- Containment
- VirusScope
- Xcitium Verdict Cloud
- Agent Discovering Settings
- External Devices Control
- Miscellaneous
- Script Analysis
- Data Loss Prevention
- XCS Access Control
- XCS Proxy
- XCS Updates
- XCS UI Settings
- XCS Logging Settings
- Performance
- Applications
- Chat
- Thumbnails
- AI
- Customers
- Reports
- Standard Reports
- Custom Reports
- The Report Catalogue
- Configure And Generate A Custom Report
- Generated Reports
- Advanced Reports
- Reports Beta
- SLA Reports
- Audit Logs
- Tools
- NuCore
- Admin
Endpoint Intelligence Monitors
- Click 'Assets' > 'Endpoint Intelligence' > 'Monitors' to open this interface.
An Endpoint Intelligence monitor is a query that runs on a schedule. Each run is judged against a pass condition, and you can be notified when a monitor starts failing and again when it recovers.
You can create monitors, see which are passing and which are not, and pause the ones you do not need right now.
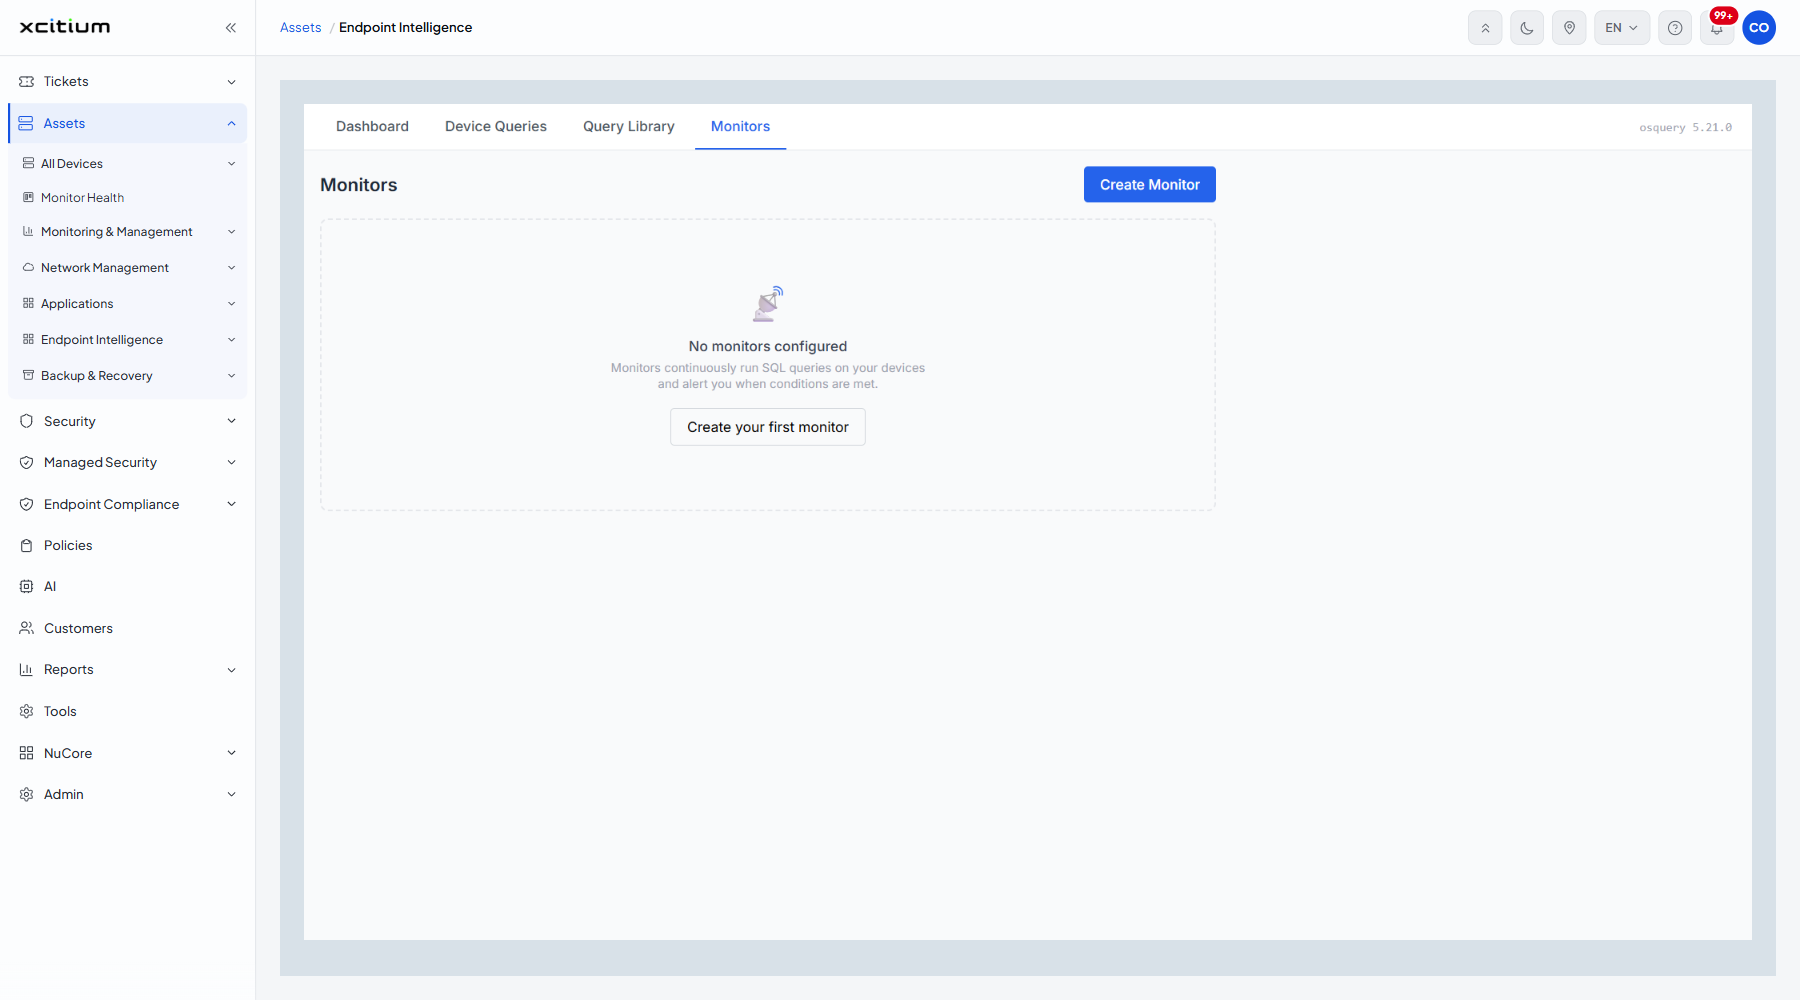
The screen
Before any monitor exists the screen shows a panel reading 'No monitors configured', the line 'Monitors continuously run SQL queries on your devices and alert you when conditions are met.', and a 'Create your first monitor' button.
Create a monitor
- Click 'Assets' > 'Endpoint Intelligence' > 'Monitors'.
- Click 'Create Monitor', or 'Create your first monitor' if you have none yet.
- Fill in the form.
You can also start from a ready-made query: click 'Create Monitor' on any card in the Query Library and the form opens with the SQL already filled in.
Note: the counts on the Endpoint Intelligence Dashboard — 'Active Monitors', 'Paused Monitors' and 'Failed Runs Today' — all come from the monitors on this screen.