


Choose the Xcitium Verdict Cloud Widgets
- Click 'Security' > 'Threat Dashboards' > 'Xcitium Verdict Cloud' > 'Customize' to open this interface.
The 'Selecting Data Set for Audit' page lists every chart the Xcitium Verdict Cloud dashboard can draw and lets you decide which of them it draws.
You can switch a data set off, switch it back on, and drag the rows to set the order the charts appear in.
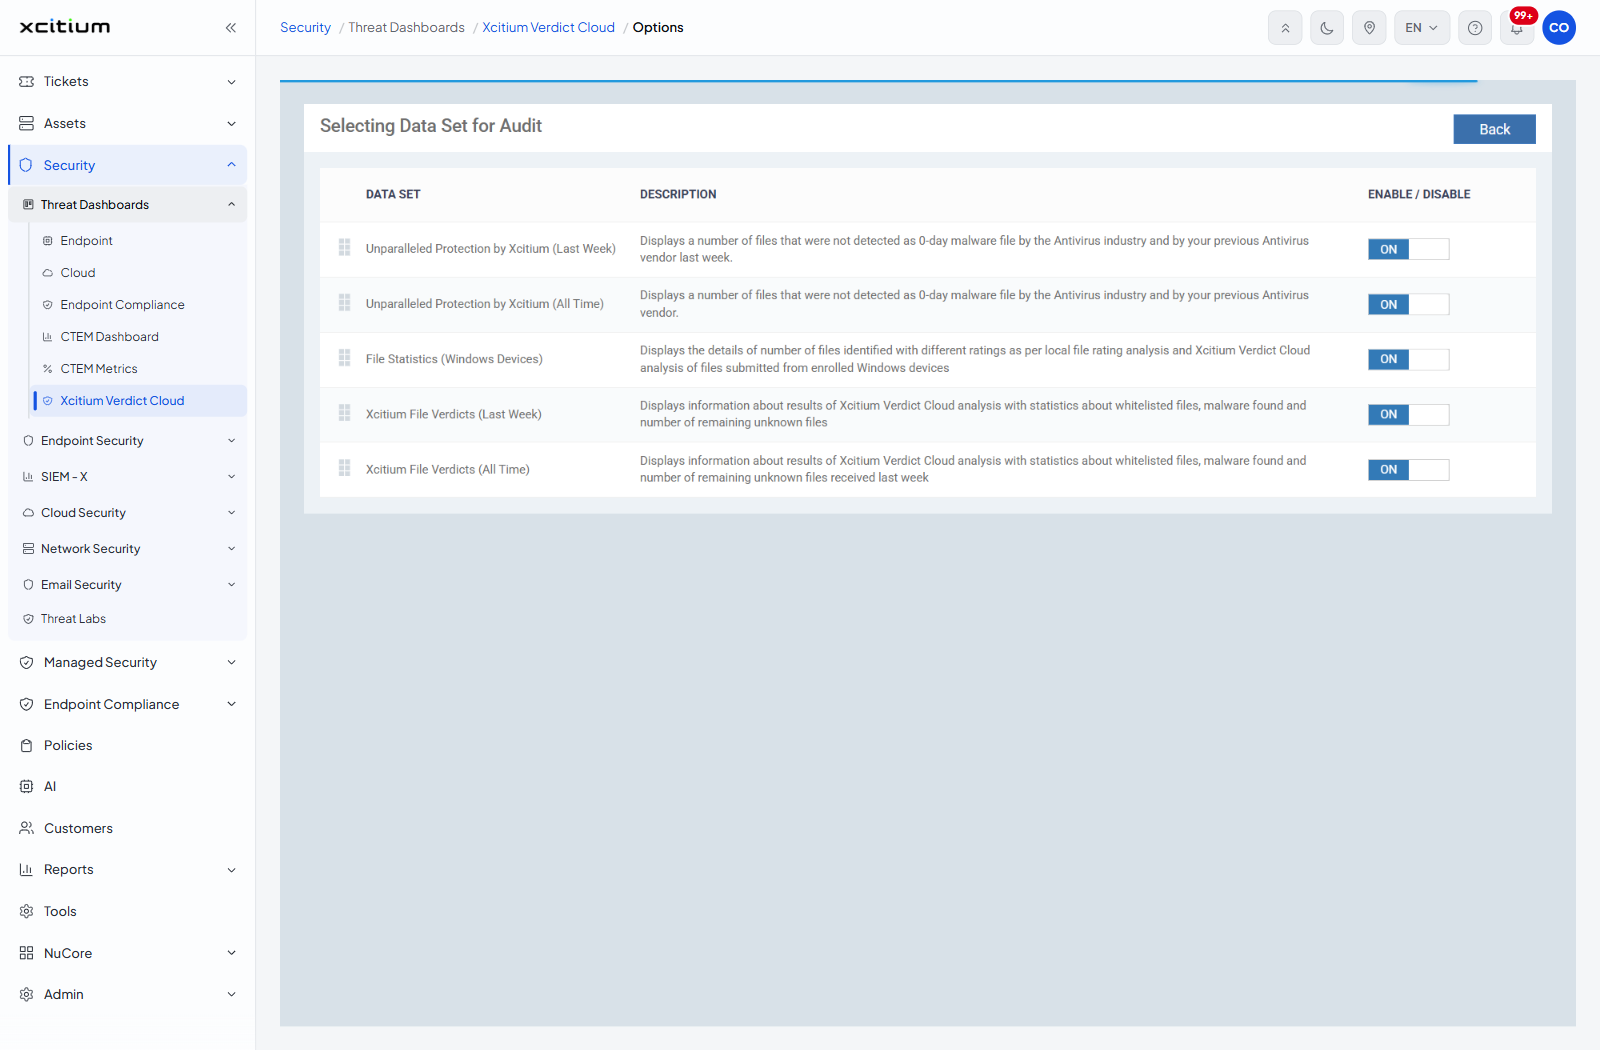
The columns
| Column | Description |
| DATA SET | The name of the chart, with a drag handle to its left. |
| DESCRIPTION | What the chart counts. |
| ENABLE / DISABLE | A switch reading 'ON' or 'OFF'. |
The data sets
| Data set | Description as shown |
| Unparalleled Protection by Xcitium (Last Week) | Displays a number of files that were not detected as 0-day malware file by the Antivirus industry and by your previous Antivirus vendor last week. |
| Unparalleled Protection by Xcitium (All Time) | Displays a number of files that were not detected as 0-day malware file by the Antivirus industry and by your previous Antivirus vendor. |
| File Statistics (Windows Devices) | Displays the details of number of files identified with different ratings as per local file rating analysis and Xcitium Verdict Cloud analysis of files submitted from enrolled Windows devices |
| Xcitium File Verdicts (Last Week) | Displays information about results of Xcitium Verdict Cloud analysis with statistics about whitelisted files, malware found and number of remaining unknown files |
| Xcitium File Verdicts (All Time) | Displays information about results of Xcitium Verdict Cloud analysis with statistics about whitelisted files, malware found and number of remaining unknown files received last week |
Turn a chart off
- Find the row for the chart.
- Click the switch so that it reads 'OFF'.
- Click 'Back' to return to the dashboard.
Note: every data set is switched 'ON' by default.