


Runtime Protection
- Click 'Security' > 'Cloud Security' > 'Runtime Protection' to open this interface.
Runtime protection watches what containers actually do once they are running - which files they touch, which processes they start, and what they talk to over the network - and blocks what the policy forbids. The 'App Behavior' tab shows that activity; the 'Policies' tab holds the rules behind it.
You can scope the view to a cluster, namespace or workload, switch between the list and the graph, change the period, add filters and choose which connections are drawn.
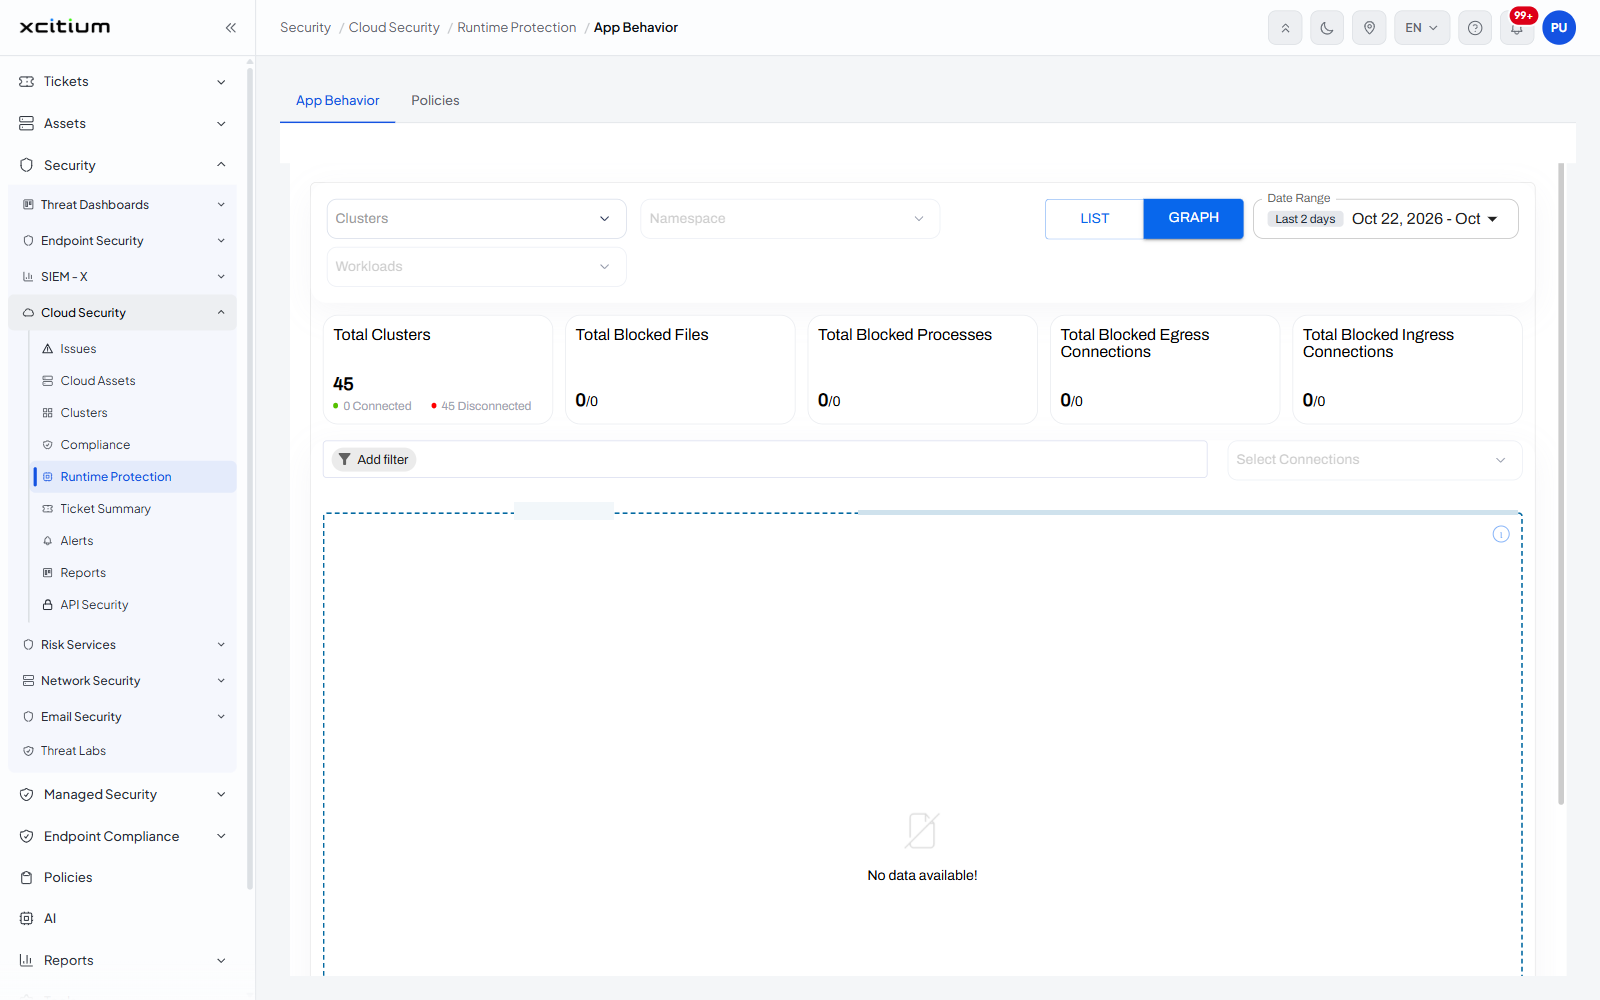
The interface
The screen has two tabs: 'App Behavior', the one it opens on, and 'Policies'. See Runtime Policies for the second.
Scope the view
| Control | Description |
| Clusters | A drop-down that picks the cluster. |
| Namespace | A drop-down that narrows to a namespace. Available once a cluster is chosen. |
| Workloads | A drop-down that narrows to a workload. Available once a namespace is chosen. |
| LIST / GRAPH | A two-part switch at the right. 'GRAPH' is selected by default and draws the activity as a connection map; 'LIST' shows it as rows. |
| Date Range | A chip naming the period, 'Last 2 days' by default, with the dates it resolves to. |
The counters
A row of tiles under the scope controls summarises the period.
| Tile | Description |
| Total Clusters | How many clusters are in scope, with a green 'Connected' count and a red 'Disconnected' count underneath. |
| Total Blocked Files | File accesses blocked, shown as blocked over total. |
| Total Blocked Processes | Process launches blocked, shown as blocked over total. |
| Total Blocked Egress Connections | Outbound connections blocked, shown as blocked over total. |
| Total Blocked Ingress Connections | Inbound connections blocked, shown as blocked over total. |
The activity view
| Control | Description |
| Add filter | A button with a funnel icon that adds a filter condition to the view. |
| Select Connections | A drop-down at the right that chooses which kinds of connection are drawn. |
| Canvas | The dashed panel below, where the graph is drawn. It carries an information icon in its top right corner and reads 'No data available!' when there is nothing to draw. |
Look at a workload's behaviour
- Choose the cluster in 'Clusters'.
- Narrow to a 'Namespace' and then a 'Workload' if you want one in particular.
- Set the 'Date Range'.
- Leave the switch on 'GRAPH' for the connection map, or click 'LIST' for rows.
- Use 'Select Connections' to limit what is drawn.