


Endpoint Compliance Dashboard
- Click 'Security' > 'Threat Dashboards' > 'Endpoint Compliance' to open this interface.
The Endpoint Compliance dashboard shows the health of your enrolled devices as a wall of doughnut charts. Each chart gives a percentage in the middle and the counts behind it on the right.
You can refresh a single chart, drag the charts into the order you want, and choose which charts appear at all.
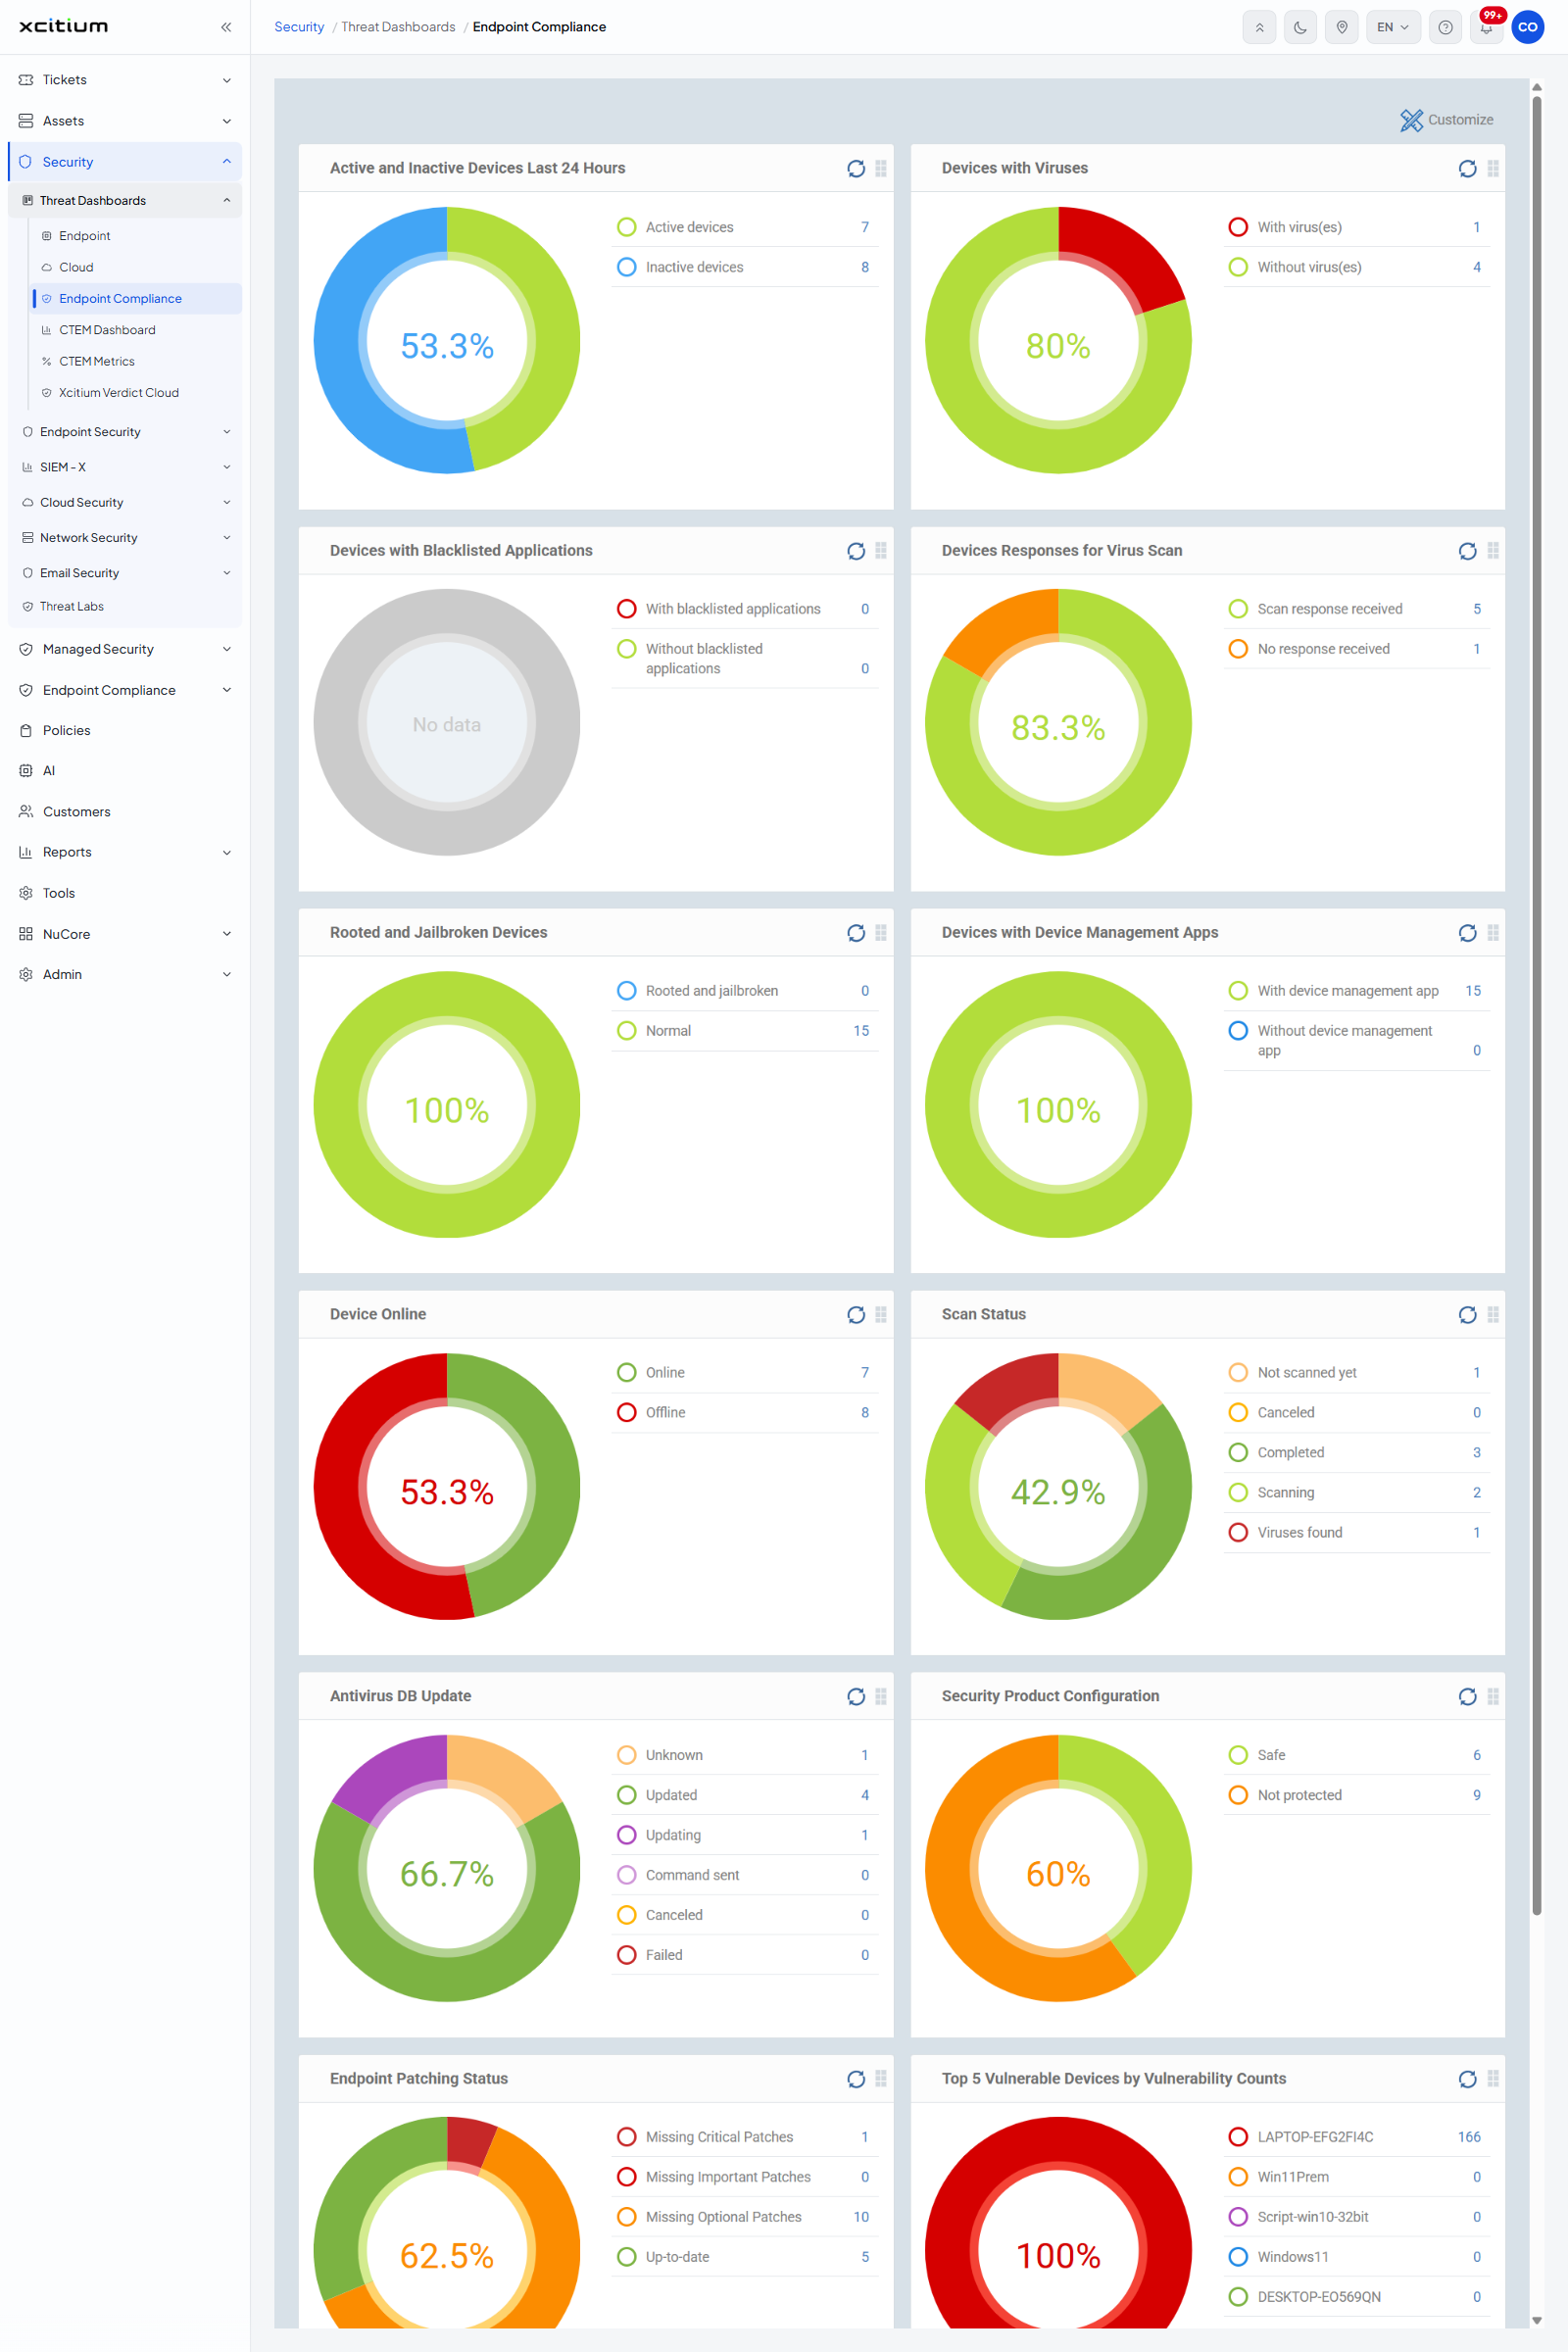
The widgets
| Widget | Series it shows |
| Active and Inactive Devices Last 24 Hours | 'Active devices' and 'Inactive devices'. |
| Devices with Viruses | 'With virus(es)' and 'Without virus(es)'. |
| Devices with Blacklisted Applications | 'With blacklisted applications' and 'Without blacklisted applications'. |
| Devices Responses for Virus Scan | 'Scan response received' and 'No response received'. |
| Rooted and Jailbroken Devices | 'Rooted and jailbroken' and 'Normal'. |
| Devices with Device Management Apps | 'With device management app' and 'Without device management app'. |
| Device Online | 'Online' and 'Offline'. |
| Scan Status | 'Not scanned yet', 'Canceled', 'Completed', 'Scanning' and 'Viruses found'. |
| Antivirus DB Update | 'Unknown', 'Updated', 'Updating', 'Command sent', 'Canceled' and 'Failed'. |
| Security Product Configuration | 'Safe' and 'Not protected'. |
| Endpoint Patching Status | 'Missing Critical Patches', 'Missing Important Patches', 'Missing Optional Patches' and 'Up-to-date'. |
| Top 5 Vulnerable Devices by Vulnerability Counts | Five device names, each with the number of vulnerabilities found on it. |
| Top 5 Vulnerability by Device Counts | Five CVE identifiers, each with the number of devices affected. |
Refresh or move a widget
- Click the circular arrow on a widget header to reload that widget on its own.
- Drag the grid handle beside it to move the widget to another position on the page.
Choose which widgets appear
- Click 'Customize' at the top right of the page. The 'Options' page opens.
- Turn a data set off or on, or drag it to reorder it.
- Click 'Back' to return to the dashboard.