


- Introduction
- Tickets
- Assets
- All Devices
- Device List
- Filter The Device List
- Group Management
- Enroll A Device
- Device Details
- View And Edit The Device Name
- View Device Summary Information
- View Network Information
- View Policies Associated With A Device
- View Applications Installed On A Device
- View The Command Queue
- View MSI Installation State
- View And Manage Patches On A Device
- View A Device's Groups
- View Device Logs
- Manage A Device's Policies
- Run A Procedure On A Device
- Install And Manage Packages On A Device
- Reboot Or Shut Down A Device
- Collect Performance Logs
- Change A Device's Owner
- Delete A Device
- Bulk Installation Package
- Device List
- Monitor Health
- Monitoring And Management
- Alerts
- Procedures
- Monitors
- Filter The Monitors List
- Create A Monitor
- A Monitor's General Tab
- A Monitor's Conditions Tab
- Add A Performance Condition
- Add A File Size Condition
- Add A Folder Size Condition
- Add A Disk Condition
- Add A Service Condition
- Add A Process Condition
- Add An Event Condition
- Add A TCP Condition
- Add A Ping Condition
- Add A Web Page Condition
- Add A Device Status Condition
- Add A Custom Script Condition
- Add A Security Events Condition
- Add A Security Client Events Condition
- Add An OS Patches Event Condition
- A Monitor's Policies Tab
- A Monitor's Logs Tab
- Clone, Import, Export And Delete Monitors
- Maintenance Windows
- Network Management
- Applications
- Endpoint Intelligence
- All Devices
- Security
- Threat Dashboards
- Endpoint Security
- SIEM - X
- Cloud Security
- Network Security
- Email Security
- Threat Labs
- Managed Security
- Endpoint Compliance
- Work With Endpoint Compliance Lists
- Agents
- All Assets
- Other Assets
- Deprecated Assets
- Problems
- Solutions
- Pending OS Patches
- Ports
- Patch Management
- Application Baseline Results
- Certificates
- Vulnerabilities
- Application Vulnerabilities
- Vulnerability By OS
- OS Vulnerabilities
- Network Scan Findings
- Compliance Standards
- Compliance Assessment
- Compliance Check Master
- Discovery Settings And Credentials
- Manage Mapping
- Jobs
- Alerts
- Policies
- The Profile List
- Policy Configuration
- Default Policies
- Predefined Policies
- The Policy Editor
- The Profile Editor
- Sections Configuration
- Add And Remove Profile Sections
- Profile Sections On Other Operating Systems
- General (Windows Profile)
- Associated Devices (Windows Profile)
- Profile Health Check
- Client Updates
- EXDR Updates
- Remote Control
- Client UI Settings
- Client Rebranding
- Client Proxy
- Client Access Control
- Remote Tools
- Monitors
- Procedures
- Patch Management
- Maintenance Window
- Global Proxy
- Client Logging Settings
- Antivirus
- Firewall
- EDR
- File Rating
- Containment
- VirusScope
- Xcitium Verdict Cloud
- Agent Discovering Settings
- External Devices Control
- Miscellaneous
- Script Analysis
- Data Loss Prevention
- XCS Access Control
- XCS Proxy
- XCS Updates
- XCS UI Settings
- XCS Logging Settings
- Performance
- Applications
- Chat
- Thumbnails
- AI
- Customers
- Reports
- Standard Reports
- Custom Reports
- The Report Catalogue
- Configure And Generate A Custom Report
- Generated Reports
- Advanced Reports
- Reports Beta
- SLA Reports
- Audit Logs
- Tools
- NuCore
- Admin
Dashboard Settings
Dashboard Settings holds the figures the executive dashboard uses to work out how much analyst time and cost your security activity represents. Change them so the dashboard reflects how your own team works.
Getting there
- Click Admin, then Settings.
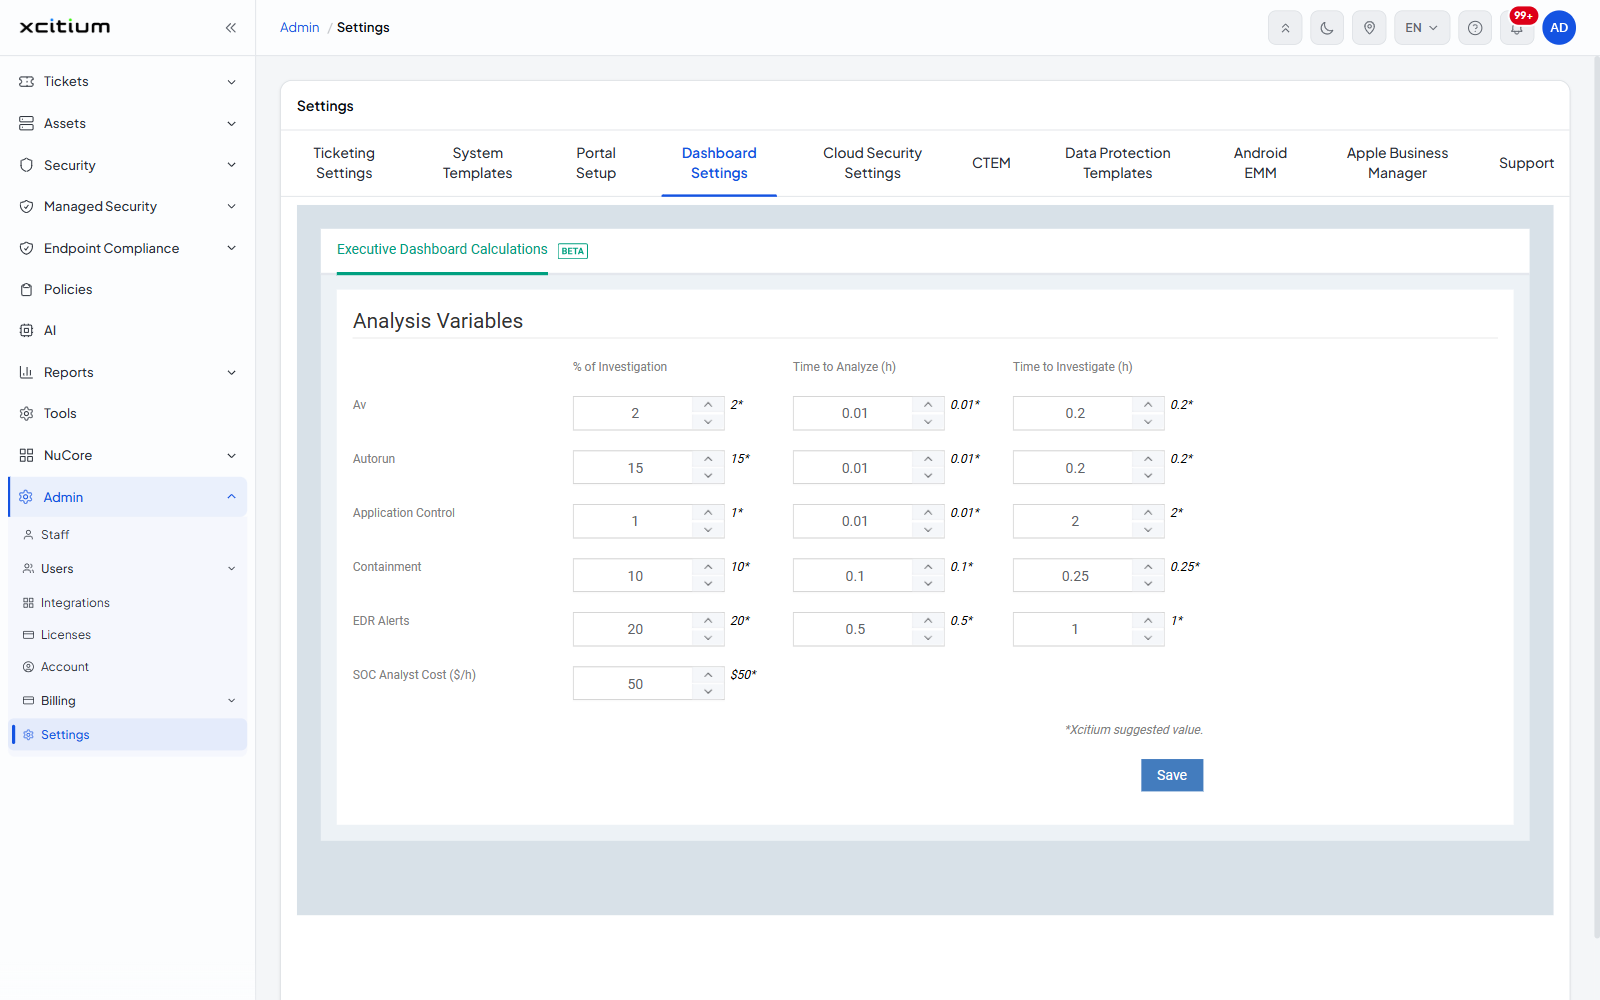
- Click the Dashboard Settings tab, then Executive Dashboard Calculations.
Changing the figures
- Under Analysis Variables, type a new value into a box, or use the arrows beside it.
- Click Save.
Each row is a kind of security activity and each column is a figure for it.
- % of Investigation — how much of that activity leads to an investigation
- Time to Analyze (h) — the hours spent analysing one item
- Time to Investigate (h) — the hours spent investigating one item
The rows
- Av
- Autorun
- Application Control
- Containment
- EDR Alerts
- SOC Analyst Cost ($/h) — the hourly rate all that time is costed at
A value marked with an asterisk is the vendor's suggested value, as the footnote under the grid explains. Changing these figures changes what the executive dashboard reports, not how the platform behaves.