


Threat Dashboards
- Click 'Security' > 'Threat Dashboards' to expand this group.
The Threat Dashboards group holds six read-only summary screens. Each one answers a different question: what is happening on the endpoints, what is happening in the connected clouds, how compliant the estate is, where the exposure is, and what the file verdict service has decided.
You can scope each dashboard to one customer, change the period a widget covers, and click through from a figure to the list behind it.
The pages in this group
| Page | Description |
| Endpoint | Alert, malware and containment figures for the enrolled devices. The landing page of the module. See Endpoint Threat Dashboard. |
| Cloud | Cloud posture: findings by provider, cloud accounts and asset trends, plus the shortcuts that onboard a cloud account, a cluster, a registry or a code repository. See Cloud Threat Dashboard. |
| Endpoint Compliance | Thirteen device-health charts, from antivirus database state to patch status. See Endpoint Compliance Dashboard. |
| CTEM Dashboard | The continuous threat exposure management canvas, driven by saved dashboard views. See CTEM Dashboard. |
| CTEM Metrics | The exposure metrics screen. See CTEM Metrics. |
| Xcitium Verdict Cloud | What the file verdict service decided about the files submitted from your devices. See Xcitium Verdict Cloud Dashboard. |
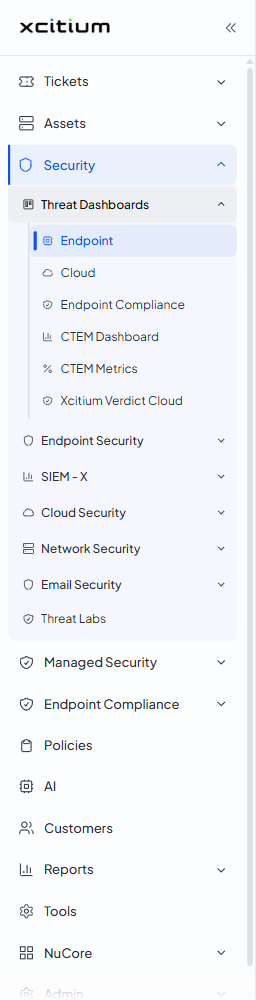
Open a threat dashboard
- Click 'Security' in the left navigation bar.
- Click 'Threat Dashboards'. The group expands.
- Click the dashboard you want.