


Add a Network Performance Condition
- Click 'Assets' > 'Network Management' > 'Monitors', open a monitor, click 'Edit', open the 'Conditions' tab, then click 'Add Condition' > 'Performance'.
The condition watches the processor or memory load reported by the network device.
You can be told when a switch or a router is working harder than it should.
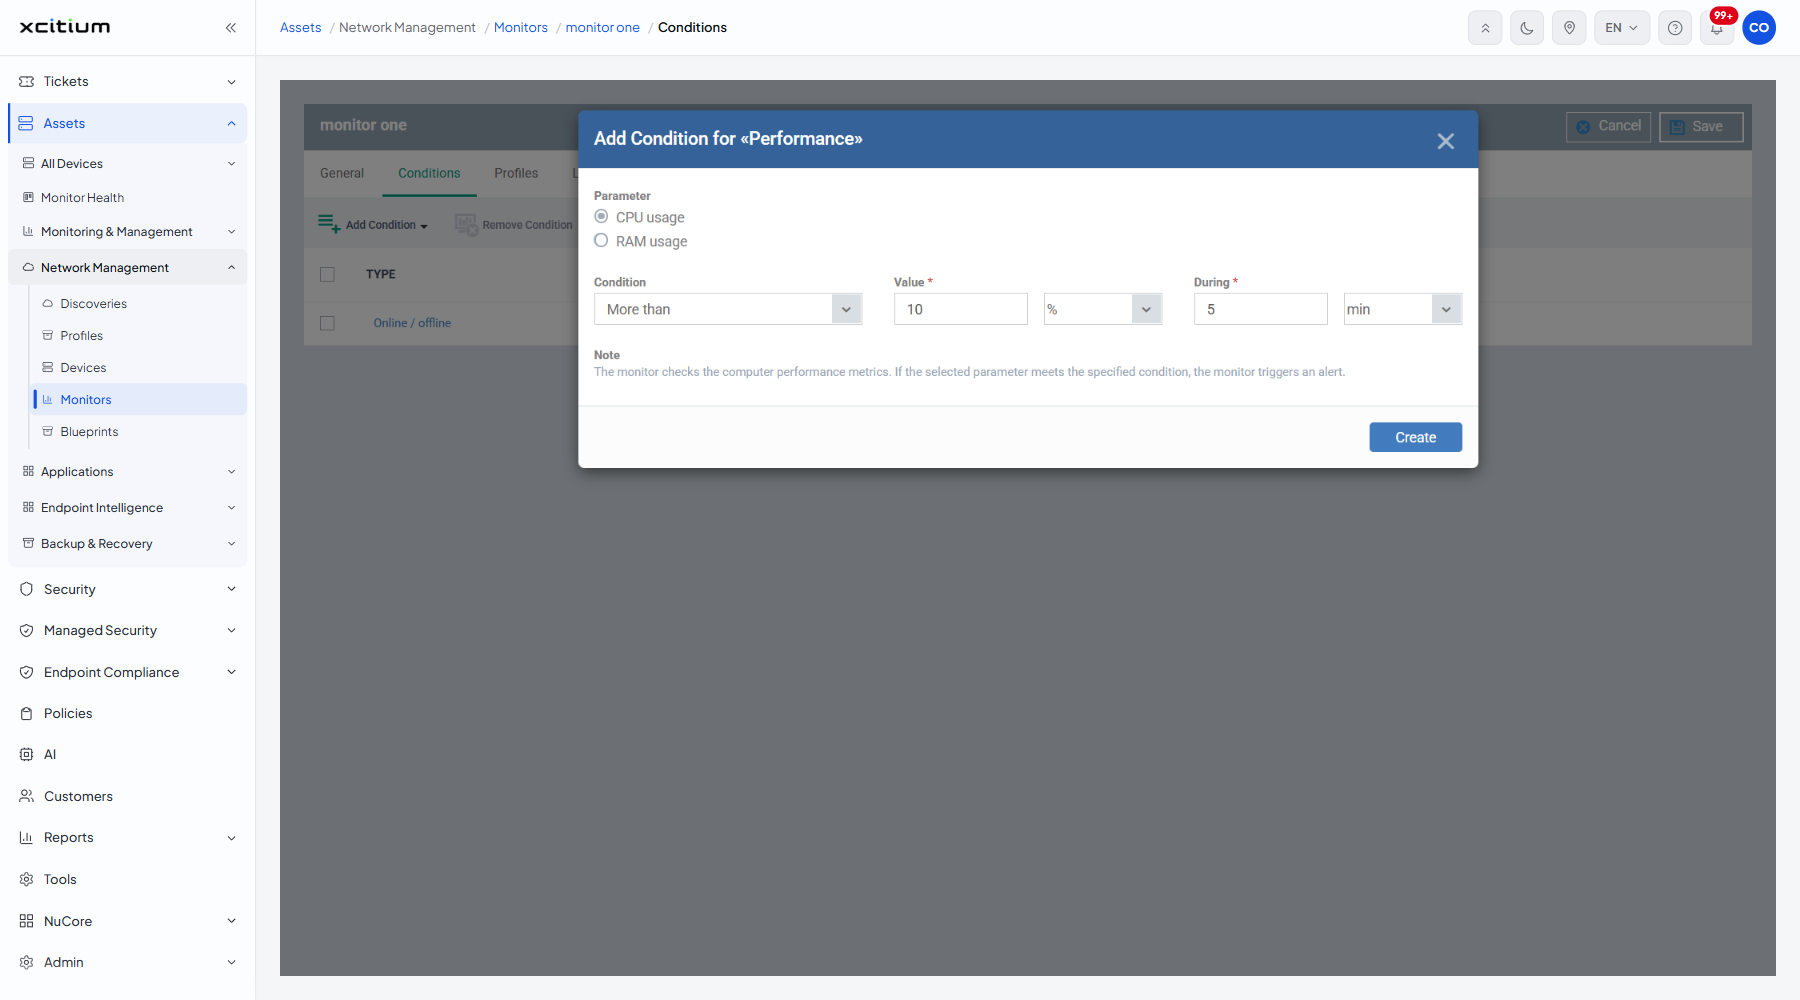
The fields
| Field | Type | Options / default | Required |
| Parameter | Radio group | 'CPU usage' (default), 'RAM usage'. Only these two; the device-monitor version of this condition also offers network usage and disk utilisation. | Yes |
| Condition | Dropdown | 'More than' (default), 'Equals to', 'Less than', 'More than or equals to', 'Less than or equals to'. | Yes |
| Value | Number box and unit | Pre-filled '10', with a unit dropdown offering '%'. | Yes |
| During | Number box and unit | Pre-filled '5', with a unit dropdown offering 'min'. | Yes |
The dialog's own note: 'The monitor checks the computer performance metrics. If the selected parameter meets the specified condition, the monitor triggers an alert.'
Add the condition
- Choose 'CPU usage' or 'RAM usage' under 'Parameter'.
- Pick the comparison in 'Condition'.
- Type the threshold into 'Value'.
- Set how long it must hold in 'During'.
- Click 'Create'.
- Click 'Save' on the monitor header to store the change.
Note: the device must report these counters over SNMP. A device that does not will never trigger the condition.